Metrics to analyze and grow user engagement
Albeit less relevant to stakeholders, customer-oriented metrics will show you how your product development efforts transform into user interactions. How many users find and use your product? How much time do they spend using it overall or a particular feature? How do customers react to a specifically planted action or feature? Also, these metrics include data on those who stopped using a product abruptly (bounce rates).
Daily Active User/Monthly Active User ratio
Besides revenue, the most valuable metrics of product growth is the number of users or subscribers for a fixed period of time. But the number of people who have subscribed or purchased your product isn’t a primary KPI. What really matters is the number of active users. Metrics of this category track how many unique visitors or users you have per day (DAU), week (WAU), or month (MAU). A unique visitor is one who visits a website at least once within a given period of time.
Daily Active User (DAU) – the number of active users per day. An “active user” is one who signed in an account and performed some valuable activities.
Monthly Active User (MAU) – the number of active users who complete valuable activities per month.
This KPI is applied to mobile apps, online games, websites, and social networks. A unique user is defined by ID and login. In identifying the “stickiness” of a product, apply DAU/MAU ratio.
DAU/MAU = # of Daily active users / # of Monthly active users

An example of DAU/MAU ratio
Source: Geckoboard
How to use DAU/MAU ratio . DAU/MAU of 20 percent is considered a good sign, while 50+ percent indicates extreme success. Growing DAU/MAU percentage allows for tracking growth or decline of a product. This ratio is used in forecasting, budgeting, or making a decision to develop new features. However, not every product must be used daily to be considered successful. You can use Uber once a week on a Friday night out or log into Airbnb twice a year. So, high-recency products are more prone to going viral.
Session duration
This KPI is the easiest way to track digital product usage. The best way to measure it is to take the total time users spend in your product, divide it by a number of users, and take the mean value. Google Analytics calculates this number for you.
How to use the session duration metric. If you calculate the session duration of a group of bounced or churned users, you may find a clue on how to improve user interaction and understand what made them stop using a product.
Traffic (paid/organic)
This KPI mostly applies to websites, while for applications and software we use the number of users. It shows the general number of people who found and visited the website. While organic traffic is related to the number of visitors who found a webpage via search, paid traffic counts those who visited it from paid sources, for example, paid search, social media ads, or sponsored content.
How to use traffic metric. Paid traffic allows you to find out whether you should continue the promotion and how correct your targeting is. Traffic metrics also allows the product manager to understand which type of marketing is more effective.
Bounce rate
Another metric is the bounce rate. It allows for measuring the percentage of users who visited only one page of a website or app and left.
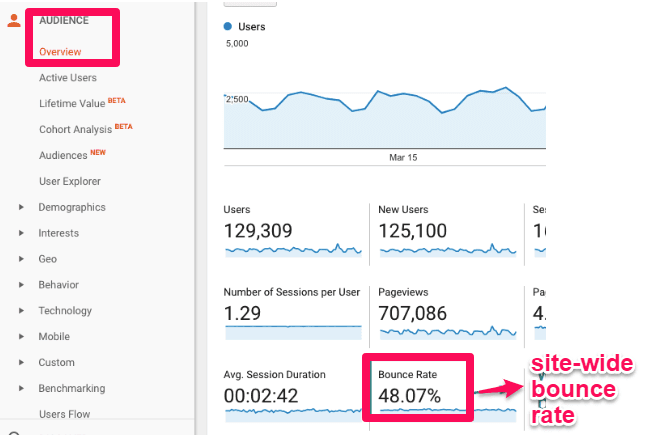
Bounce rate in Google Analytics
Source: Neil Patel
How to use bounce rate. Bounce rate allows you to track the user behavior and understand how to optimize your product to reduce this number and increase user attention. The next section focuses on more KPIs for attracting the users.
Do leave a LIKE if this helped you, and don’t forget to drop in a comment if there are any suggestions!!