This is data science different topic explanation conversation series.
If you are not following below mentioned are the links for each part.
Part-1:
Part-2:
Part-3:
Part-4:
Part-5:
Part-6:
Part-7:
Continuous distributions
We investigate probabilistic distributions of continuous random variables, i.e. random variables whose support contains an infinite range of possible outcomes.
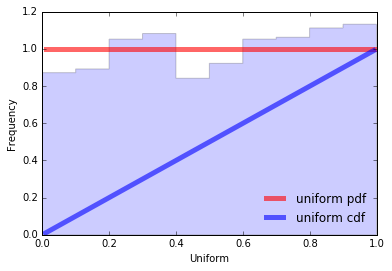
Uniform Distribution
A uniform distribution is a type of distribution of probabilities where all outcomes are equally likely; each variable has the same probability that it will be the outcome. A deck of cards has within tis uniform distributions because the probability that a heart, club, diamond, or spade is pulled is the same. The coin also has a uniform distribution because the probability of either the head or the tail in the coin toss is the same.
from scipy.stats import uniform
import matplotlib.pyplot as plt
import numpy as np


def uniform() -> None:
    fig, ax = plt.subplots(1, 1, figsize=(15,15))
    # calculate a few first moments
    mean, var, skew, kurt = uniform.stats(moments='mvsk')
    # display the probability density function (`pdf`)
    x = np.linspace(uniform.ppf(0.01), uniform.ppf(0.99), 100)
    ax.plot(x, uniform.pdf(x),
        'r-', lw=5, alpha=0.6, label='uniform pdf')
    ax.plot(x, uniform.cdf(x),
        'b-', lw=5, alpha=0.6, label='uniform cdf')
    # Check accuracy of `cdf` and `ppf`
    vals = uniform.ppf([0.001, 0.5, 0.999])
    np.allclose([0.001, 0.5, 0.999], uniform.cdf(vals))

    # generate random numbers
    r = uniform.rvs(size=1000)
    # and compare the histogram
    ax.hist(r, normed=True, histtype='stepfilled', alpha=0.2)
    ax.legend(loc='best', frameon=False)
    plt.show()

uniform()
Make sure give this post a like for support and motivation for fresh content.
Continuing the left over content here for above post.
More formally this is the distribution of a random variable that can take any value in the interval (a,b) and the probability of being in any segment inside (a,b) is proportional to the length of the segment and does not depend on its position, and the probability of values outside the interval (a,b) is equal to 0.
So, a continuous random variable x has a uniform distribution, denoted U(a,b) if its probability density function is: