What is the Z Test?
z tests are a statistical way of testing a hypothesis when either:
- We know the population variance, or
- We do not know the population variance but our sample size is large n ≥ 30
If we have a sample size of less than 30 and do not know the population variance, then we must use a t-test.
One-Sample Z test
We perform the One-Sample Z test when we want to compare a sample mean with the population mean. 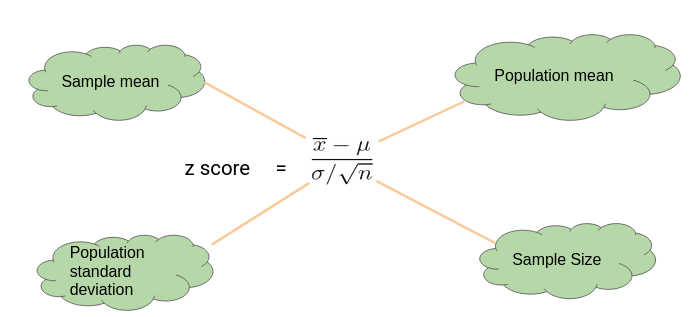
Here’s an Example to Understand a One Sample Z Test
Let’s say we need to determine if girls on average score higher than 600 in the exam. We have the information that the standard deviation for girls’ scores is 100. So, we collect the data of 20 girls by using random samples and record their marks. Finally, we also set our ⍺ value (significance level) to be 0.05.
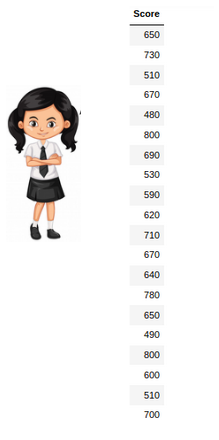
In this example:
- Mean Score for Girls is 641
- The size of the sample is 20
- The population mean is 600
- Standard Deviation for Population is 100
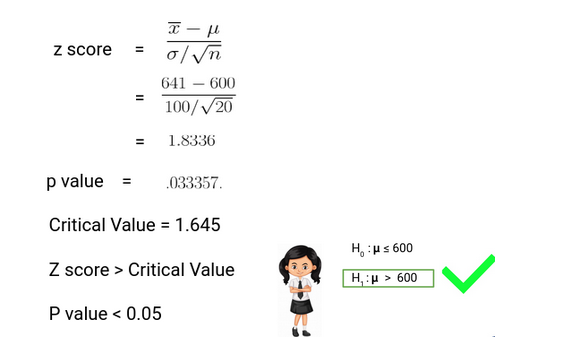
Since the P-value is less than 0.05, we can reject the null hypothesis and conclude based on our result that Girls on average scored higher than 600.
Two Sample Z Test
We perform a Two Sample Z test when we want to compare the mean of two samples.

Here’s an Example to Understand a Two Sample Z Test
Here, let’s say we want to know if Girls on average score 10 marks more than the boys. We have the information that the standard deviation for girls’ Score is 100 and for boys’ score is 90. Then we collect the data of 20 girls and 20 boys by using random samples and record their marks. Finally, we also set our ⍺ value (significance level) to be 0.05.
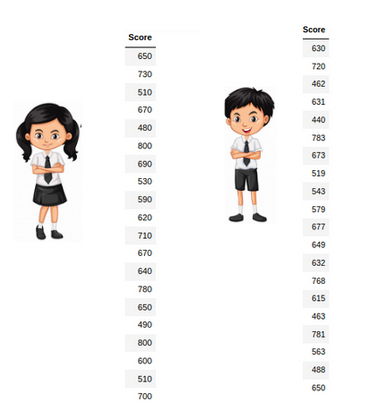
In this example:
- Mean Score for Girls (Sample Mean) is 641
- Mean Score for Boys (Sample Mean) is 613.3
- Standard Deviation for the Population of Girls’ is 100
- Standard deviation for the Population of Boys’ is 90
- Sample Size is 20 for both Girls and Boys
- Difference between Mean of Population is 10
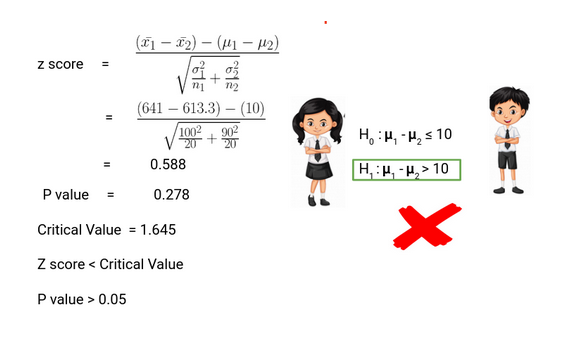
Thus, we can conclude based on the P-value that we fail to reject the Null Hypothesi s. We don’t have enough evidence to conclude that girls on average score of 10 marks more than the boys. Pretty simple, right?
What is the t-Test?
t-tests are a statistical way of testing a hypothesis when:
- We do not know the population variance
- Our sample size is small, n < 30
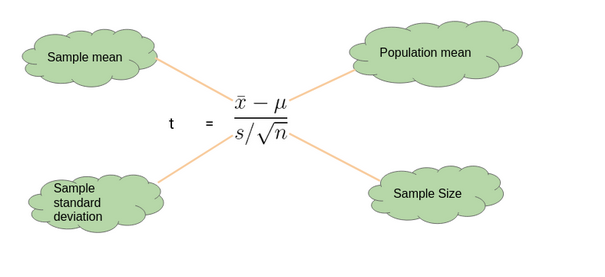
One-Sample t-Test
We perform a One-Sample t-test when we want to compare a sample mean with the population mean . The difference from the Z Test is that we do not have the information on Population Variance here. We use the sample standard deviation instead of population standard deviation in this case.
Here’s an Example to Understand a One Sample t-Test
Let’s say we want to determine if on average girls score more than 600 in the exam. We do not have the information related to variance (or standard deviation) for girls’ scores. To a perform t-test, we randomly collect the data of 10 girls with their marks and choose our ⍺ value (significance level) to be 0.05 for Hypothesis Testing.
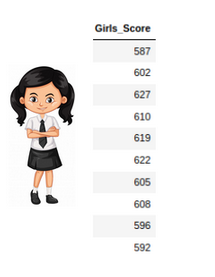
In this example:
- Mean Score for Girls is 606.8
- The size of the sample is 10
- The population mean is 600
- Standard Deviation for the sample is 13.14

Our P-value is greater than 0.05 thus we fail to reject the null hypothesis and don’t have enough evidence to support the hypothesis that on average, girls score more than 600 in the exam.
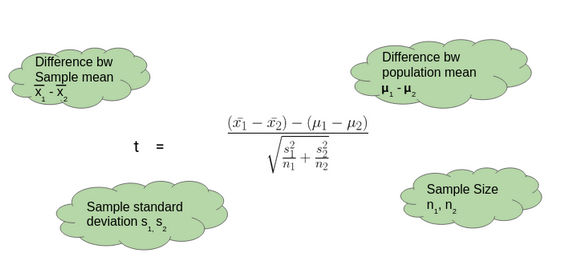
Two-Sample t-Test
We perform a Two-Sample t-test when we want to compare the mean of two samples.
Here’s an Example to Understand a Two-Sample t-Test
Here, let’s say we want to determine if on average, boys score 15 marks more than girls in the exam. We do not have the information related to variance (or standard deviation) for girls’ scores or boys’ scores. To perform a t-test. we randomly collect the data of 10 girls and boys with their marks. We choose our ⍺ value (significance level) to be 0.05 as the criteria for Hypothesis Testing.
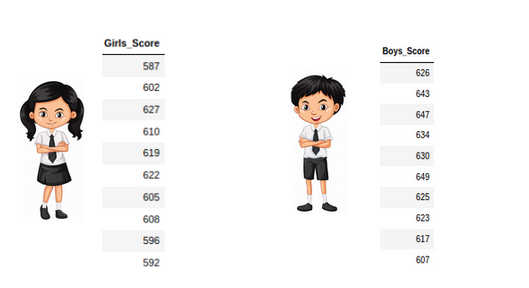
In this example:
- Mean Score for Boys is 630.1
- Mean Score for Girls is 606.8
- Difference between Population Mean 15
- Standard Deviation for Boys’ score is 13.42
- Standard Deviation for Girls’ score is 13.14
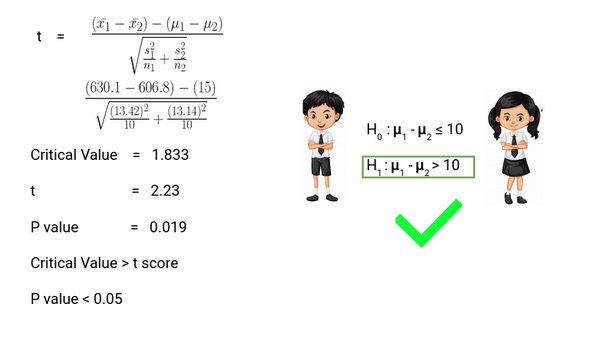
Thus, P-value is less than 0.05 so we can reject the null hypothesis and conclude that on average boys score 15 marks more than girls in the exam.
Deciding between Z Test and T-Test
So when we should perform the Z test and when we should perform t-Test? It’s a key question we need to answer if we want to master statistics.
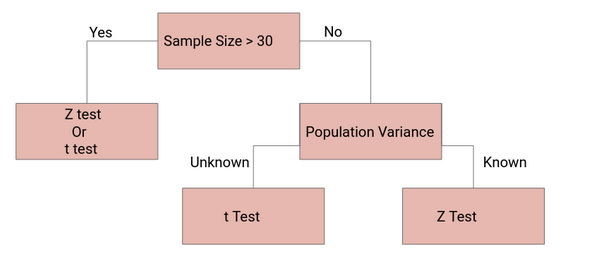
If the sample size is large enough, then the Z test and t-Test will conclude with the same results. For a large sample size , Sample Variance will be a better estimate of Population variance so even if population variance is unknown, we can use the Z test using sample variance.
Similarly, for a Large Sample , we have a high degree of freedom. And since t -distribution approaches the normal distribution , t he difference between the z score and t score is negligible.