What is the difference between a box plot and a histogram?
Well Box plot and Histogram can be used use Seaborn . where Box plot is Used using .boxplot and Histogram is used using .countplot.
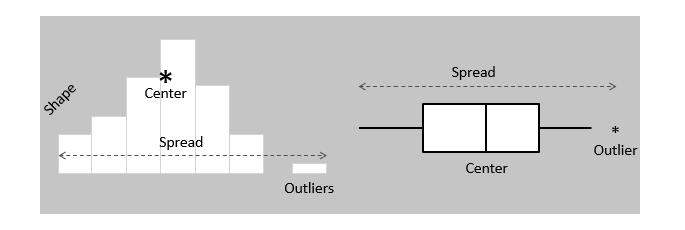
Box plot - gives the quartiles and indicate the median data to compare easily
Histogram - gives only the count
Histograms and box plots are graphical representations for the frequency of numeric data values. They aim to describe the data and explore the central tendency and variability before using advanced statistical analysis techniques.
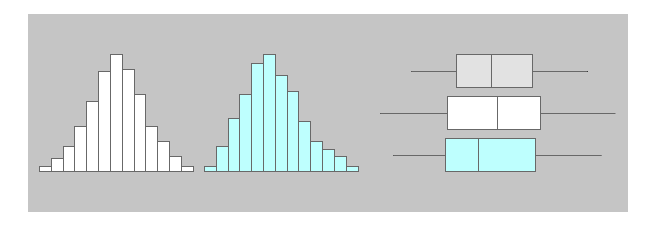
Both histograms and box plots allow to visually assess the central tendency, the amount of variation in the data as well as the presence of gaps, outliers or unusual data points.
Both histograms and box plots are used to explore and present the data in an easy and understandable manner. Histograms are preferred to determine the underlying probability distribution of a data. Box plots on the other hand are more useful when comparing between several data sets. They are less detailed than histograms and take up less space.