This is again one of the popular metrics used in the industry. The biggest advantage of using ROC curve is that it is independent of the change in proportion of responders. This statement will get clearer in the following sections.
Let’s first try to understand what is ROC (Receiver operating characteristic) curve. If we look at the confusion matrix below, we observe that for a probabilistic model, we get different value for each metric.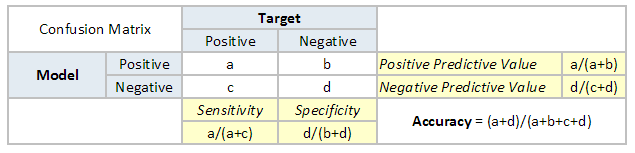
Hence, for each sensitivity, we get a different specificity.The two vary as follows:

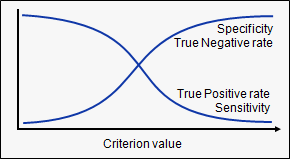
The ROC curve is the plot between sensitivity and (1- specificity). (1- specificity) is also known as false positive rate and sensitivity is also known as True Positive rate. Following is the ROC curve for the case in hand.

Let’s take an example of threshold = 0.5 (refer to confusion matrix). Here is the confusion matrix :
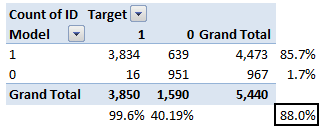
As you can see, the sensitivity at this threshold is 99.6% and the (1-specificity) is ~60%. This coordinate becomes on point in our ROC curve. To bring this curve down to a single number, we find the area under this curve (AUC).
Note that the area of entire square is 1*1 = 1. Hence AUC itself is the ratio under the curve and the total area. For the case in hand, we get AUC ROC as 96.4%. Following are a few thumb rules:
- .90-1 = excellent (A)
- .80-.90 = good (B)
- .70-.80 = fair ©
- .60-.70 = poor (D)
- .50-.60 = fail (F)
We see that we fall under the excellent band for the current model. But this might simply be over-fitting. In such cases it becomes very important to to in-time and out-of-time validations.
Points to Remember:
-
For a model which gives class as output, will be represented as a single point in ROC plot.
-
Such models cannot be compared with each other as the judgement needs to be taken on a single metric and not using multiple metrics. For instance, model with parameters (0.2,0.8) and model with parameter (0.8,0.2) can be coming out of the same model, hence these metrics should not be directly compared.
-
In case of probabilistic model, we were fortunate enough to get a single number which was AUC-ROC. But still, we need to look at the entire curve to make conclusive decisions. It is also possible that one model performs better in some region and other performs better in other.