K-S or Kolmogorov-Smirnov chart measures performance of classification models. More accurately, K-S is a measure of the degree of separation between the positive and negative distributions. The K-S is 100, if the scores partition the population into two separate groups in which one group contains all the positives and the other all the negatives.
On the other hand, If the model cannot differentiate between positives and negatives, then it is as if the model selects cases randomly from the population. The K-S would be 0. In most classification models the K-S will fall between 0 and 100, and that the higher the value the better the model is at separating the positive from negative cases.
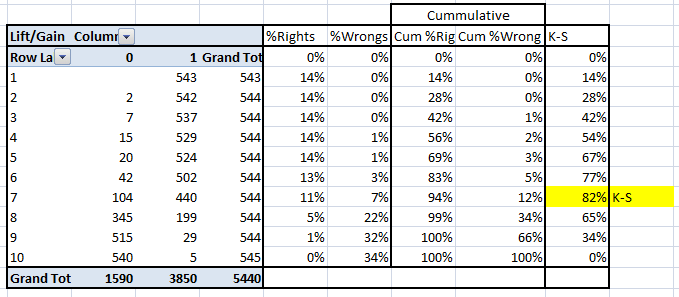
For the case in hand, following is the table :
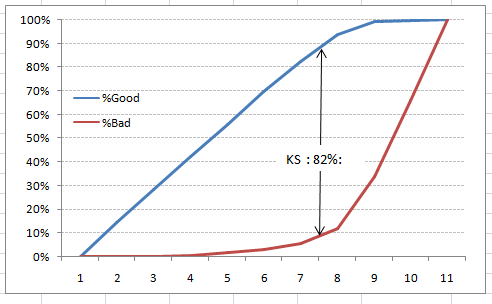
We can also plot the %Cumulative Good and Bad to see the maximum separation. Following is a sample plot :
The metrics covered till here are mostly used in classification problems. Till here, we learnt about confusion matrix, lift and gain chart and kolmogorov-smirnov chart. Let’s proceed and learn few more important metrics.