Understanding Random Forest Classification and Building a Model in Python
Learn how the random forest algorithm works for the classification task.
Random forest is a supervised learning algorithm. It can be used both for classification and regression. It is also the most flexible and easy to use algorithm. A forest is comprised of trees. It is said that the more trees it has, the more robust a forest is. The random forest creates decision trees on randomly selected data samples, gets a prediction from each tree, and selects the best solution by means of voting. It also provides a pretty good indicator of the feature’s importance.
The random forest has a variety of applications such as recommendation engines, image classification, and feature selection. It can be used to classify loyal loan applicants, identify fraudulent activity, and predict diseases. It lies at the base of the Boruta algorithm, which selects important features in a dataset.
In this tutorial, you are going to learn about all of the following:
- Random forest algorithm
- How does the random forest classifier work?
- Finding important features
- Comparison between random forest and decision trees
- Building a classifier in scikit-learn
- Finding important features with scikit-learn
- Its advantages and disadvantages
Photo by Sarah Evans on Unsplash
Random Forest Algorithm
Let’s understand the random forest in layman’s words. Suppose you want to go on a trip and you would like to go to a place which you will like.
So what you do to identify a better place which you like? You can search online read lots of people’s opinions on travel blogs, Quora, travel portals, or you can also ask your friends.
Let’s suppose you have decided to ask your friends and talked with them about their past travel experience in various places. You will get some recommendations from every friend. Now you have to make a list of those recommended places. Then, you ask them to vote(or select one best place for the trip) from a given list of recommended places. The place with the highest number of votes will be your final choice for the trip.
In the above decision process, there are two parts. First, asking friends about their individual travel experience and getting one recommendation out of multiple places they have visited. This part is using the decision tree algorithm. Here each friend makes a selection of the places he or she has visited so far.
Second, after collecting all the recommendations and you performed the voting procedure for selecting the best place. Voting means choosing the best place for given recommendations on the basis of friends’ experience. This whole process (first and second part both) of recommendation from friends and voting for finding the best place is known as the Random forest algorithm.
Technically, the random forest is an ensemble method (based on the divide-and-conquer approach) of decision trees generated on the randomly split dataset. This collection of decision tree classifiers is known as the forest. Every individual decision trees are generated using an attribute selection indicator such as information gain, gain ratio, and Gini index of each attribute. Each tree depends upon the independent random sample. In a classification problem, each tree votes, and the most popular class is chosen as the final result. In the case of regression, the average of all the tree outputs is considered as the final result. It is more simple and powerful compared to the other non-linear classification algorithms.
Originally published at https://www.datacamp.com/community/tutorials/random-forests-classifier-python
How does Random Forest work?
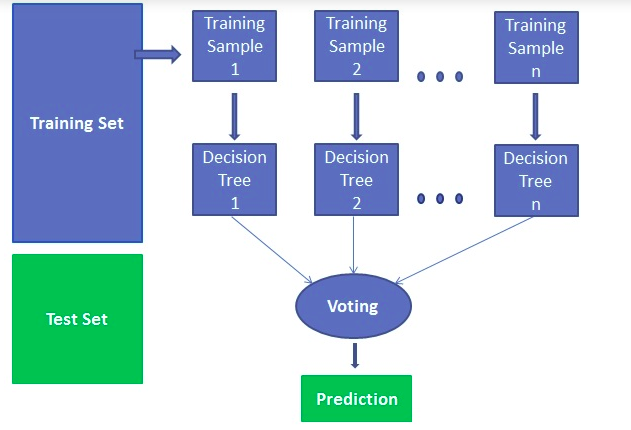
It works in four steps:
- Select random samples from a given dataset.
- Construct a decision tree for each sample and get a prediction result from each decision tree.
- Perform a vote for each predicted result.
- Select the prediction result with the most votes as the final prediction.
Finding important features
The random forest also offers a good feature selection indicator. Scikit-learn provides an extra variable with the random forest model, which shows the relative importance or contribution of each feature in the prediction. It automatically computes the relevance score of each feature in the training phase. Then it scales the relevance down so that the sum of all scores is 1.
This score will help to choose the most important features and drop the least important ones for model building.
Random forest uses gini importance or mean decrease in impurity (MDI) to calculate the importance of each feature. Gini importance is known as a total decrease in node impurity. This is how much the model fit or accuracy decreases when you drop a variable. The larger the decrease, the more significant the variable is. Here the mean decrease is a significant parameter for variable selection. The gini index can describe the overall explanatory power of the variables.
Random Forests vs Decision Trees
- Random forest is a set of multiple decision trees.
- Deep decision trees may suffer from overfitting but random forest prevents overfitting by creating trees on random subsets.
- Decision trees are computationally faster than Random Forests.
- Random forest is difficult to interpret while a decision tree is easily interpretable and can be converted to rules.
Building a Classifier using Scikit-learn
You will be building a model on the iris flower dataset, which is a very famous classification set. It comprises sepal length, sepal width, petal length, petal width, and type of flower. There are three species or classes: Setosa, Versicolor, and Virginica. You will build a model to classify the type of flower. The dataset is available in the scikit-learn library or you can download it from UCI Machine Learning Repository.
Start by importing the datasets library from scikit-learn, and load the iris dataset with load_iris() .
#Import scikit-learn dataset library
from sklearn import datasets

#Load dataset
iris = datasets.load_iris()
You can print the target and feature names, to make sure you have the right dataset, as such:
# print the label species(setosa, versicolor,virginica)
print(iris.target_names)

# print the names of the four features
print(iris.feature_names)
Output: [‘setosa’ ‘versicolor’ ‘virginica’] [‘sepal length (cm)’, ‘sepal width (cm)’, ‘petal length (cm)’, ‘petal width (cm)’]
It’s a good idea to always explore your data a bit, so you know what you’re working with. Here, you can see the first five rows of the dataset are printed, as well as the target variable for the whole dataset.
# print the label species(setosa, versicolor,virginica)
print(iris.target_names)

# print the names of the four features
print(iris.feature_names)
Output:
[[ 5.1 3.5 1.4 0.2]
[ 4.9 3. 1.4 0.2]
[ 4.7 3.2 1.3 0.2]
[ 4.6 3.1 1.5 0.2]
[ 5. 3.6 1.4 0.2]]
[0 0 0 0 0 0 0 0 0 0 0 0 0 0 0 0 0 0 0 0 0 0 0 0 0 0 0 0 0 0 0 0 0 0 0 0 0 0 0 0 0 0 0 0 0 0 0 0 0 0 1 1 1 1 1 1 1 1 1 1 1 1 1 1 1 1 1 1 1 1 1 1 1 1 1 1 1 1 1 1 1 1 1 1 1 1 1 1 1 1 1 1 1 1 1 1 1 1 1 1 2 2 2 2 2 2 2 2 2 2 2 2 2 2 2 2 2 2 2 2 2 2 2 2 2 2 2 2 2 2 2 2 2 2 2 2 2 2 2 2 2 2 2 2 2 2 2 2 2 2]
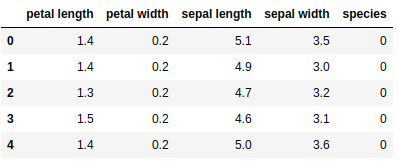
Here, you can create a dataframe of iris data set in the following way.
# Creating a dataframe of given iris dataset.
import pandas as pd

data=pd.DataFrame({sepal length':iris.data[:,0],'sepal width':iris.data[:,1],'petal length':iris.data[:,2],'petal width':iris.data[:,3],'species':iris.target})

data.head()
Output:
First, you separate the columns into dependent and independent variables(or features and labels). Then you split those variables into train and test set.
# Import train_test_split function
from sklearn.model_selection import train_test_split

X=data[['sepal length', 'sepal width', 'petal length', 'petal width']]   # Features
y=data['species']

# Split dataset into training set and test set
X_train, X_test, y_train, y_test = train_test_split(X, y, test_size=0.3) # 70% training and 30% test
After splitting, you will generate a random forest model on the training set and perform prediction on test set features.
#Import Random Forest Model
from sklearn.ensemble import RandomForestClassifier
#Create a Gaussian Classifier
clf=RandomForestClassifier(n_estimators=100)
#Train the model using the training sets
y_pred=clf.predict(X_test)
clf.fit(X_train,y_train)
y_pred=clf.predict(X_test)
After model generation, check the accuracy using actual and predicted values.
#Import scikit-learn metrics module for accuracy calculation
from sklearn import metrics

# Model Accuracy, how often is the classifier correct?

print("Accuracy:",metrics.accuracy_score(y_test, y_pred))
Outout: (‘Accuracy:’, 0.93333333333333335)
you can also make a prediction for a single individual.
For example,
sepal length=3 sepal width=5 petal length=4 petal width=2
Now you can predict the “Which type of flower is?”
clf.predict([[3, 5, 4, 2]])
Output: array([2])
Here, 2 indicates the flower type: ‘Virginica’
Finding Important Features in Scikit-learn
Here, you are finding important features or selecting features in a given IRIS dataset. In scikit-learn, you can perform this task in the following steps:
- First, you need to create a random forest model.
- Second, use the feature importance variables to see feature importance scores.
- Third, visualize these scores using the seaborn library.
#Import Random Forest Model

from sklearn.ensemble import RandomForestClassifier

#Create a Gaussian Classifier
clf=RandomForestClassifier(n_estimators=100)

#Train the model using the training sets
y_pred=clf.predict(X_test)

clf.fit(X_train,y_train)
Output: RandomForestClassifier(bootstrap=True, class_weight=None, criterion=‘gini’, max_depth=None, max_features=‘auto’, max_leaf_nodes=None, min_impurity_decrease=0.0, min_impurity_split=None, min_samples_leaf=1, min_samples_split=2, min_weight_fraction_leaf=0.0, n_estimators=100, n_jobs=1, oob_score=False, random_state=None, verbose=0, warm_start=False)
import pandas as pd
feature_imp = pd.Series(clf.feature_importances_,index=iris.feature_names).sort_values(ascending=False)
print(feature_imp)
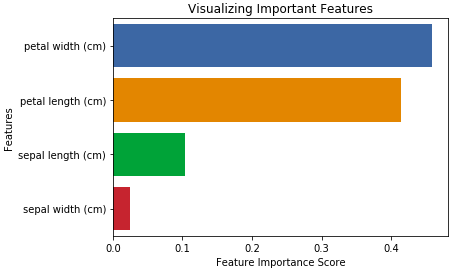
Output: petal width (cm) 0.458607
petal length (cm) 0.413859
sepal length (cm) 0.103600
sepal width (cm) 0.023933
dtype: float64
You can also visualize the feature importance. Visualization is easy to understand and interpretable. Also, visualization has the highest bandwidth channel to the human brain.
For visualizing you can use a combination of matplotlib and seaborn because seaborn built on top of matplotlib, offers a number of customized themes, and provides additional plot types. Matplotlib is a superset of seaborn and both are equally required for good visualization.
import matplotlib.pyplot as plt
import seaborn as sns
%matplotlib inline

# Creating bar plot
sns.barplot(x=feature_imp, y=feature_imp.index)

# Add labels in your graph
plt.xlabel('Feature Importance Score')

plt.ylabel('Features')plt.title("Visualizing Important Features")

plt.legend()
plt.show()
Again Generating Model on Selected Features
Here, you can remove the feature “sepal width” and select the remaining 3 features because it has very low importance.
# Import train_test_split function
from sklearn.cross_validation import train_test_split

# Split dataset into features and labels
X=data[['petal length', 'petal width','sepal length']]  # Removed feature "sepal length"

y=data['species']

# Split dataset into training set and test set
X_train, X_test, y_train, y_test = train_test_split(X, y, test_size=0.70, random_state=5) # 70% training and 30% test
After splitting, you will generate a random forest model on selected training set features, perform prediction on selected test set features and compare actual and predicted values.
#Import Random Forest Model
from sklearn.ensemble import RandomForestClassifier

#Create a Gaussian Classifier
clf=RandomForestClassifier(n_estimators=100)

#Train the model using the training sets
y_pred=clf.predict(X_test)
clf.fit(X_train,y_train)

# prediction on test set
y_pred=clf.predict(X_test)

#Import scikit-learn metrics module for accuracy calculation
from sklearn import metrics

# Model Accuracy, how often is the classifier correct?

print("Accuracy:",metrics.accuracy_score(y_test, y_pred))
Output: (‘Accuracy:’, 0.95238095238095233
Here you can see, after removing less important features(sepal length) accuracy got increased because it reduces misleading data and noise, which increases the accuracy. Also, less number of important feature reduces training time.
Advantages:
- Random forest considered a highly accurate and robust method because the number of decision tree participate in the prediction process.
- The random forest does not suffer from overfitting problem. The basic reason is that random forest takes the average of all the predictions, which makes the biases cancel out.
- Random Forest can be utilized in both kinds of problems(classification and regression problems).
- The random forest can also handle the missing values. There are two ways to handle missing values in the random forest. First, it uses the median value to fill continuous variables, and second, computes the proximity-weighted average of the missing values.
- The random forest also gives relative feature importance which helps in selecting most contributing features for the |classifier.
Disadvantages:
- Random forest is slow to create predictions because it has multiple decision trees, whenever random forest makes predictions all the trees in the forest to make predictions for the same given input and then perform voting on it. This whole process is time-consuming.
- Random forest models difficult to interpret compared to the decision tree, where you easily make the decision by following the path in the tree.
Conclusion
Congratulations, you have made it to the end of this tutorial!
In this tutorial, you have learned about what random forest is, how it works, finding important features, comparison between random forest and decision tree, advantages, and disadvantages. You have also learned model building, evaluation, and finding important features in scikit-learn. Don’t stop here! I recommend you try random forest on different datasets and read more on the confusion matrix.