1 Like
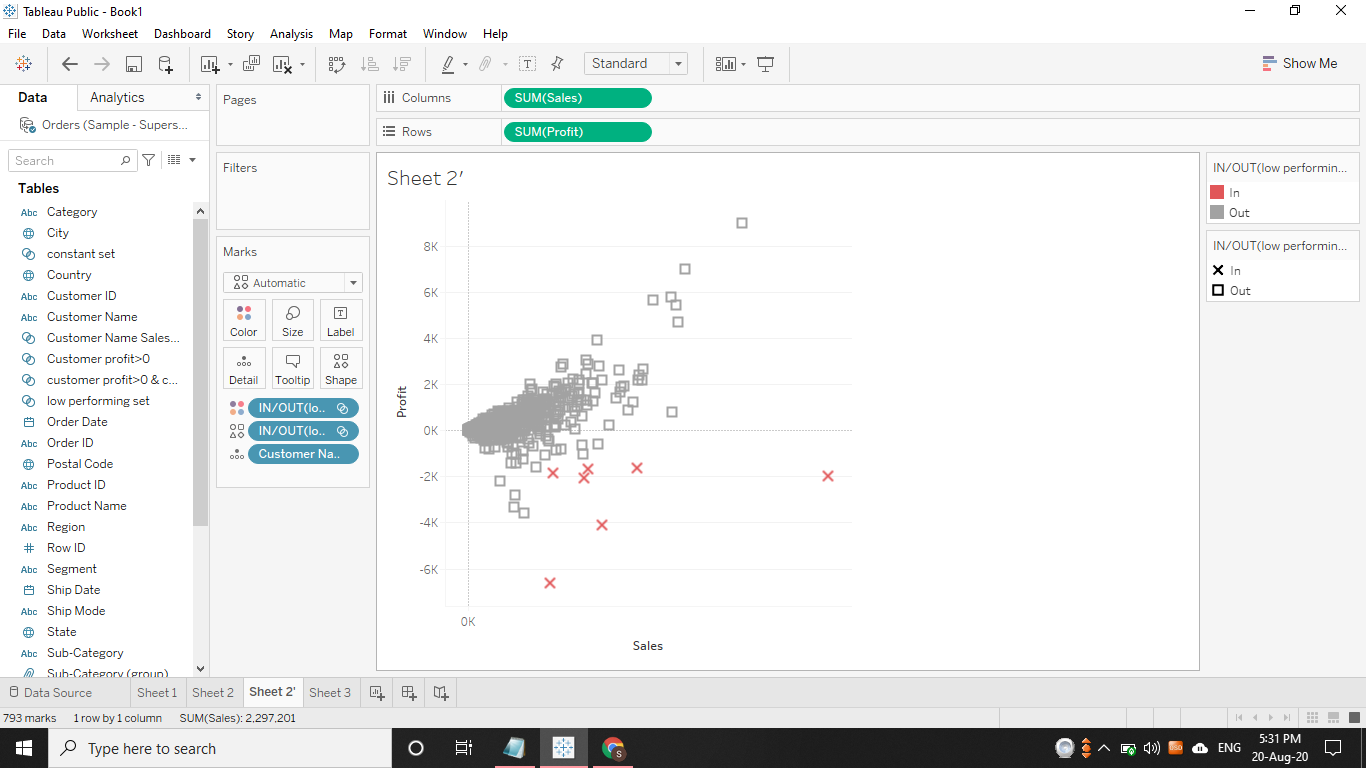
go to sum(sales) , right click, click on show header u will be able to see scale…scales are called headers in tableau so whether its x axis or y axis u need to click show header
2 Likes
ok thanks for your reply.
Thanks
