Tableau Table Calculations
A table calculation is a transformation that applies to the values in a visualization. Table calculation is a special type of calculated field that computes on the local data in Tableau.
They are calculated based on current visualization and do not consider any dimensions or measures that are filtered out of the visualization.
These calculations are applied to the values of the entire table, not on the some selected rows or columns.
Table calculations are used for a variety of purposes, such as:
- Transforming values to rankings.
- Transforming values to show running totals.
- Transforming values to show the percent of the total.
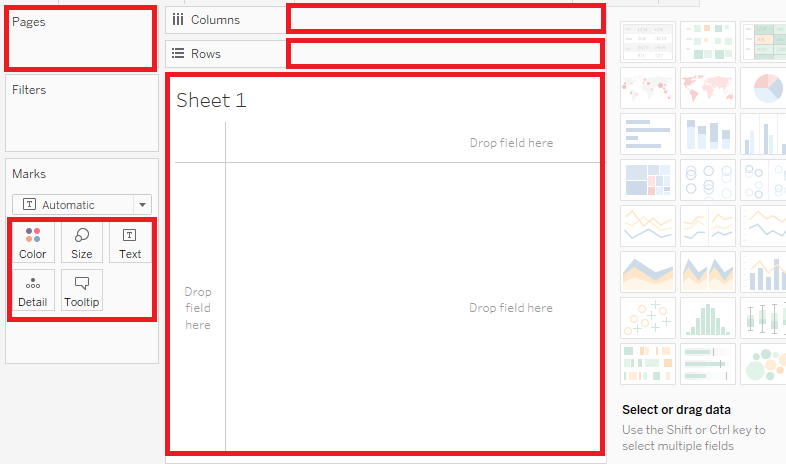
For any Tableau visualization, there is a virtual table which is determined by the dimensions in the view. This table is not the same as the tables in your data source. Mainly, the virtual table is determined by the dimensions within the " level of detail " means the dimensions on any of the following shelves in a Tableau worksheet:
For example , for calculating an average, we need to apply a single method of calculations on an entire column. These calculations cannot be performed on some selected rows.
The table has a feature known as " Quick Table Calculations ", which is used to create such calculations.
Following are the steps applied in quick table calculations as:
Step1: Select the Measure on which the table calculation has to be used and drag it to the column shelf.
Step2: Right-click on the Measure and choose the option Quick Table Calculation .
Step3: Choose one option among the following options to be applied to the Measure .
ADVERTISEMENT
- Running Total
- Difference
- Percent Difference
- Percent of Total
- Rank
- Percentile
- Moving Average
- Year to Date (YTD) Total
- Compound Growth Rate
- Year over Year Growth
- Year to Date (YTD) Growth
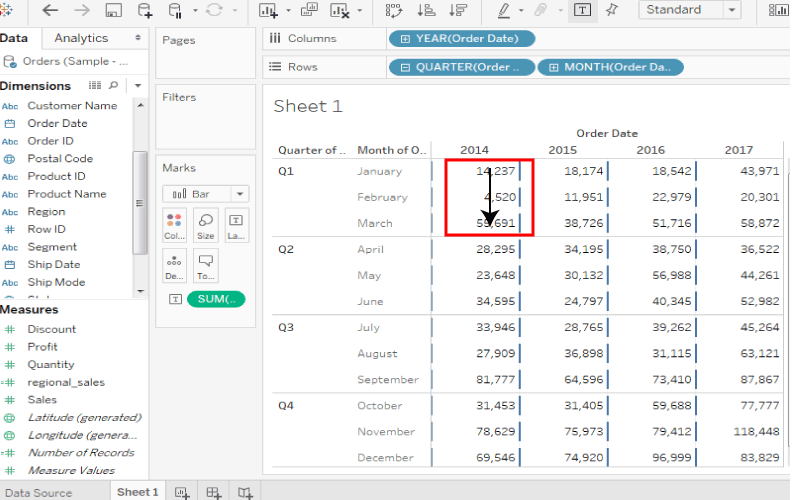
1. Table (Across): It computes across the length of the table and restarts after every partition.
For example , in the below screenshot, the calculation is computed across columns such as “Year (Order Date)” for every row such as “Month (Order Date)”.

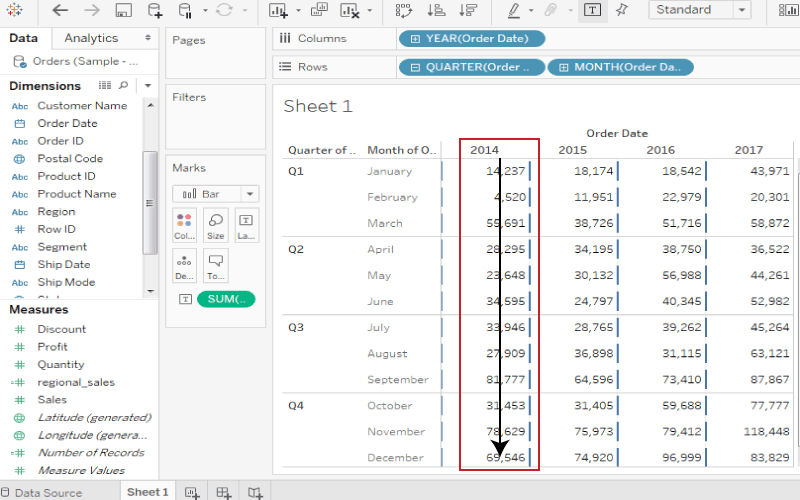
2. Table (Down): It computes down the length of the table and restarts after every partition.
For example , in the below screenshot, the calculation is computed down rows such as “Month (Order Date)” for every column such as “Year (Order Date)”.
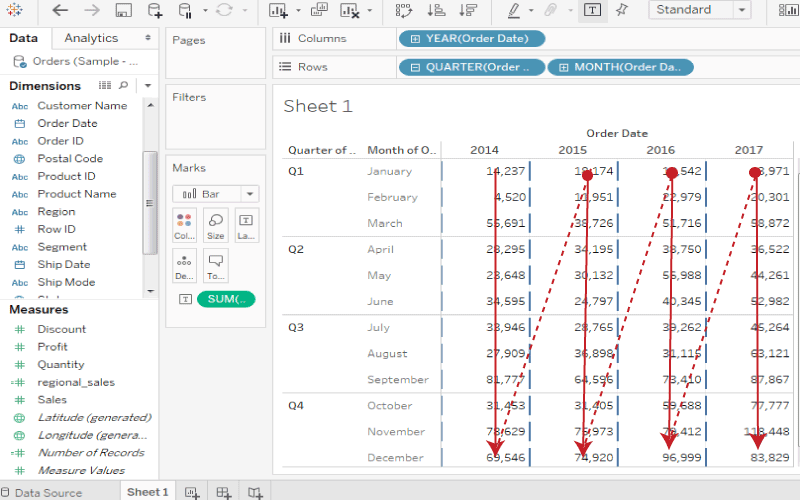
3. Table (Across then Down): It computes across the length of the table, and then down the length of the table.
For example , in the below screenshot, the calculation is computed across columns such as “Year (Order Date)”, down a row such as “Month (Order Date)”, and then across columns again for the entire table.

4. Table (Down then Across): It computes down the length of the table, and then across the length of the table.
For example , in the below screenshot, the calculation is computed down rows such as “Month (Order Date)”, across a column such as “Year (Order Date)”, and then down rows again.
5. Pane (Down): It computes down an entire pane.
For example , in the below screenshot, the calculation is computed down rows such as “Month (Order Date)” for a single pane.
6. Pane (Across then Down): It computes across an entire pane and then down the pane.
For example: In the below screenshot, the calculation is computed across columns such as “Year (Order Date)” for the length of the pane, down a row such as “Month (Order Date)”, and then across columns for the length of the pane again.

7. Pane (Down then Across): It computes down an entire pane and then across the pane.
For example , in the below screenshot, the calculation is computed down rows such as “Month (Order Date)” for the length of the pane, across a column such as “Year (Order Date)”, and then down the length of the pane again.
