L
[su_table]
| ### Word | ### Description |
|---|---|
| Labeled Data | A labeled dataset has a meaningful “label”, “class” or “tag” associated with each of its records or rows. For example, labels for a dataset of a set of images might be whether an image contains a cat or a dog. |
Labeled data are usually more expensive to obtain than the raw unlabeled data because preparation of the labelled data involves manual labelling every piece of unlabeled data.
Labeled data is required for supervised learning algorithms.|
|Lasso Regression|Lasso regression performs L1 regularization , i.e. it adds a factor of sum of absolute value of coefficients in the optimization objective. Thus, lasso regression optimizes the following:
Objective = RSS + α * (sum of absolute value of coefficients)
Here, α (alpha) works similar to that of ridge and provides a trade-off between balancing RSS and magnitude of coefficients. Like that of ridge, α can take various values. Let’s iterate it briefly here:
- α = 0 : Same coefficients as simple linear regression
- α = ∞ : All coefficients zero (same logic as before)
- 0 < α < ∞ : coefficients between 0 and that of simple linear regression|
|Line Chart|Line charts are used to display information as series of points connected by straight line segment. These charts are used to communicate information visually, such as to show an increase or decrease in the trend in data over intervals of time.
In the plot below, for each time instance, the speed trend is shown and the points are connected to display the trend over time.
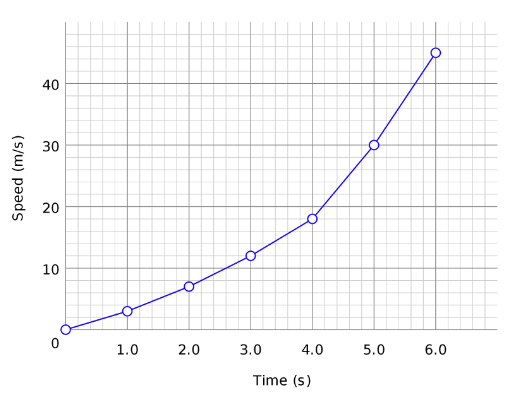
This plot is for a single case. Line charts can also be used to compare changes over the same period of time for multiple cases, like plotting the speed of a cycle, car, train over time in the same plot.|
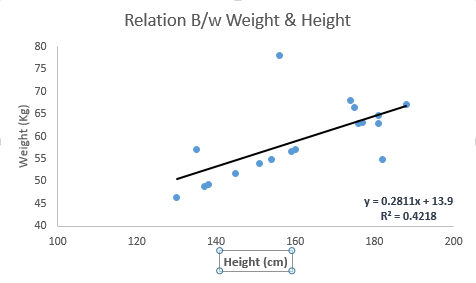
|Linear Regression|The best way to understand linear regression is to relive this experience of childhood. Let us say, you ask a child in fifth grade to arrange people in his class by increasing order of weight, without asking them their weight! What do you think the child will do? He / she would likely look (visually analyze) at the height and build of people and arrange them using a combination of these visible parameters. This is linear regression in real life. The child has actually figured out that height and build would be correlated to the weight by a relationship, which looks like the equation below.
Y=aX+b
where:
- Y – Dependent Variable
- a – Slope
- X – Independent variable
- b – Intercept
These coefficients a and b are derived based on minimizing the sum of squared difference of distance between data points and regression line.
Look at the below example. Here we have identified the best fit line having linear equation y=0.2811x+13.9 . Now using this equation, we can find the weight, knowing the height of a person.
 |
|
|Log Loss|Log Loss or Logistic loss is one of the evaluation metrics used to find how good the model is. Lower the log loss, better is the model. Log loss is the logarithm of the product of all probabilities.
Mathematically, log loss for two classes is defined as:
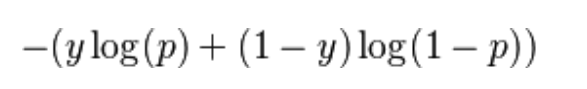
where, y is the class label and p is the predicted probability.|
|Logistic Regression|In simple words, it predicts the probability of occurrence of an event by fitting data to a logistic function. Hence, it is also known as logistic regression . Since, it predicts the probability, the output values lies between 0 and 1 (as expected).|
|Long Short Term Memory (LSTM)|Long short-term memory (LSTM) units (or blocks) are a building unit for layers of a recurrent neural network (RNN). A common LSTM unit is composed of a cell, an input gate, an output gate and a forget gate. The cell is responsible for “remembering” values over arbitrary time intervals, hence the word “memory” in LSTM. Each of the three gates can be thought of as a “conventional” artificial neuron, as in a multi-layer neural network, that is, they compute an activation (using an activation function) of a weighted sum. Applications of LSTM include:
- Time series predictions
- Speech recognition
- Rhythm learning
- Handwriting recognition