
 SQL
SQL
 HTML/CSS/JS
 Coding


 Settings
 Logout
C
[su_table]
Word ### Description
Categorical Variable Categorical variables (or nominal variables) are those variables which have discrete qualitative values. For example, names of cities are categorical like Delhi, Mumbai, Kolkata.
Classification It is supervised learning method where the output variable is a category, such as “Male” or “Female” or “Yes” and “No”.
For example: Classification Algorithms like Logistic Regression, Decision Tree, K-NN, SVM etc.
Classification Threshold Classification threshold is the value which is used to classify a new observation as 1 or 0. When we get an output as probabilities and have to classify them into classes, we decide some threshold value and if the probability is above that threshold value we classify it as 1, and 0 otherwise. To find the optimal threshold value, one can plot the AUC-ROC and keep changing the threshold value. The value which will give the maximum AUC will be the optimal threshold value.
Clustering Clustering is an unsupervised learning method used to discover the inherent groupings in the data. For example: Grouping customers on the basis of their purchasing behaviour which is further used to segment the customers. And then the companies can use the appropriate marketing tactics to generate more profits.
Example of clustering algorithms: K-Means, hierarchical clustering, etc.
Computer Vision Computer Vision is a field of computer science that deals with enabling computers to visualize, process and identify images/videos in the same way that a human vision does. In the recent times, the major driving forces behind Computer Vision has been the emergence of deep learning, rise in computational power and a huge amount of image data. The image data can take many forms, such as video sequences, views from multiple cameras, or multi-dimensional data from a medical scanner. Some of the key applications of Computer Vision are:
- Pedestrians, cars, road detection in smart (self-driving) cars
- Object recognition
- Object tracking
- Motion analysis
- Image restoration
Concordant-Discordant Ratio Concordant and discordant pairs are used to describe the relationship between pairs of observations. To calculate the concordant and discordant pairs, the data are treated as ordinal. The number of concordant and discordant pairs are used in calculations for Kendall’s tau, which measures the association between two ordinal variables.
Let’s say you had two movie reviewers rank a set of 5 movies:
Movie Reviewer 1 Reviewer 2
A 1 1
B 2 2
C 3 4
D 4 3
E 5 6
The ranks given by the reviewer 1 are ordered in ascending order, this way we can compare the rankings given by both the reviewers.
Concordant Pair – 2 entities would form a concordant pair if one of them is ranked higher than the other consistently. For example, in the table above B and D form a concordant pair because B has been ranked higher than D by both the reviewers.
Discordant Pair – C and D are discordant because they have been ranked in opposite order by the reviewers.
Concordant Pair or Discordant Pair ratio = (No. of concordant or discordant pairs) / (Total pairs tested)
Confidence Interval A confidence interval is used to estimate what percent of a population fits a category based on the results from a sample population. For example, if 70 adults own a cell phone in a random sample of 100 adults, we can be fairly confident that the true percentage amongst the population is somewhere between 61% and 79%.
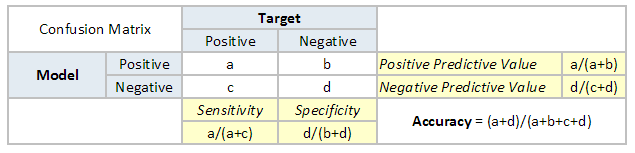
Confusion Matrix A confusion matrix is a table that is often used to describe the performance of a classification model. It is a N * N matrix, where N is the number of classes. We form confusion matrix between prediction of model classes Vs actual classes. The 2nd quadrant is called type II error or False Negatives, whereas 3rd quadrant is called type I error or False positives
Continuous Variable Continuous variables are those variables which can have infinite number of values but only in a specific range. For example, height is a continuous variable.
Convergence Convergence refers to moving towards union or uniformity. An iterative algorithm is said to converge when as the iterations proceed the output gets closer and closer to a specific value.
Convex Function A real value function is called convex if the line segment between any two points on the graph of the function lies above or on the graph.
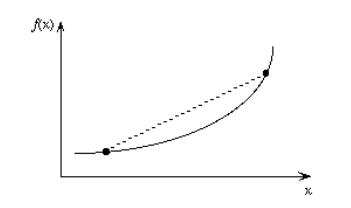
Convex functions play an important role in many areas of mathematics. They are especially important in the study of optimization problems where they are distinguished by a number of convenient properties.
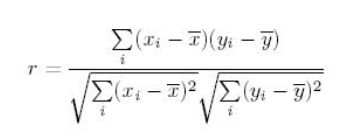
Correlation Correlation is the ratio of covariance of two variables to a product of variance (of the variables). It takes a value between +1 and -1. An extreme value on both the side means they are strongly correlated with each other. A value of zero indicates a NIL correlation but not a non-dependence. You’ll understand this clearly in one of the following answers.
The most widely used correlation coefficient is Pearson Coefficient. Here is the mathematical formula to derive Pearson Coefficient.
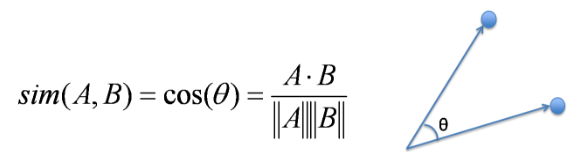
Cosine Similarity Cosine Similarity is the cosine of the angle between 2 non-zero vectors. Two parallel vectors have a cosine similarity of 1 and two vectors at 90° have a cosine similarity of 0. Suppose we have two vectors A and B, cosine similarity of these vectors can be calculated by dividing the dot product of A and B with the product of the magnitude of the two vectors.
Cost Function Cost function is used to define and measure the error of the model. The cost function is given by:
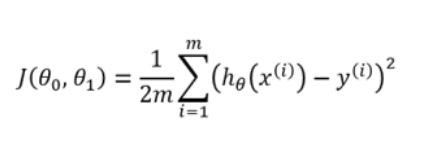
Here,
- h(x) is the prediction
- y is the actual value
- m is the number of rows in the training set
Let us understand it with an example:
So let’s say, you increase the size of a particular shop, where you predicted that the sales would be higher. But despite increasing the size, the sales in that shop did not increase that much. So the cost applied in increasing the size of the shop, gave you negative results. So, we need to minimize these costs. Therefore we make use of cost function to minimize the loss.
Covariance Covariance is a measure of the joint variability of two random variables. It’s similar to variance, but where variance tells you how a single variable varies, co variance tells you how two variables vary together. The formula for covariance is:
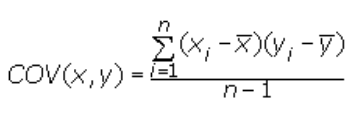
Where,
x = the independent variable
y = the dependent variable
n = number of data points in the sample
x bar = the mean of the independent variable x
y bar = the mean of the dependent variable y
A positive covariance means the variables are positively related, while a negative covariance means the variables are inversely related .
Cross Entropy In information theory, the cross entropy between two probability distributions and over the same underlying set of events measures the average number of bits needed to identify an event drawn from the set, if a coding scheme is used that is optimized for an “unnatural” probability distribution , rather than the “true”. Cross entropy can be used to define the loss function in machine learning and optimization.
Cross Validation Cross Validation is a technique which involves reserving a particular sample of a dataset which is not used to train the model. Later, the model is tested on this sample to evaluate the performance. There are various methods of performing cross validation such as:
- Leave one out cross validation (LOOCV)
- k-fold cross validation
- Stratified k-fold cross validation
- Adversarial validation
[/su_table]