Power BI Dashboard
Power BI dashboard is a single page, also called a canvas that uses visualization to tell the story. It is limited to one page; therefore, a well-designed dashboard contains only the most essential elements of that story.
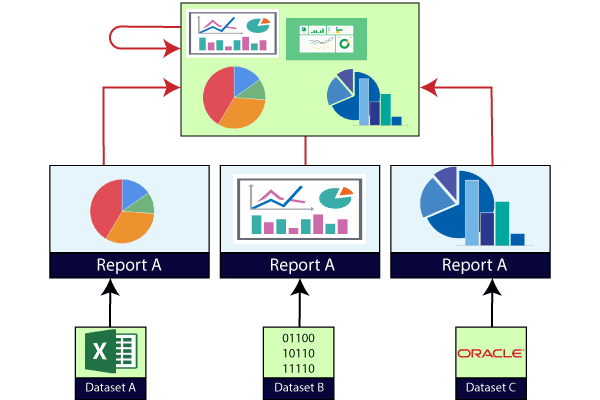
The visualizations visible on the dashboard are known as tiles. These tiles are pinned to the dashboard from reports. The visualizations on a dashboard come from reports, and each report is based on one data set.
A dashboard can combine on-premises and cloud-born data. And they are providing a consolidated view regardless of where the data lies.
Creating Dashboard in Power BI
We need to import one sample datasets of the Power BI and use it to create a new dashboard.
For example, suppose a sample such as Procurement Analysis . This sample is an excel workbook with two PowerView sheets.
When Power BI imports the workbook, it adds a dataset and a report to the workspace. Let’s see step by step.
Step 1: Open the Power BI Desktop and click on the File pane.
Step 2: Go to the Import option.
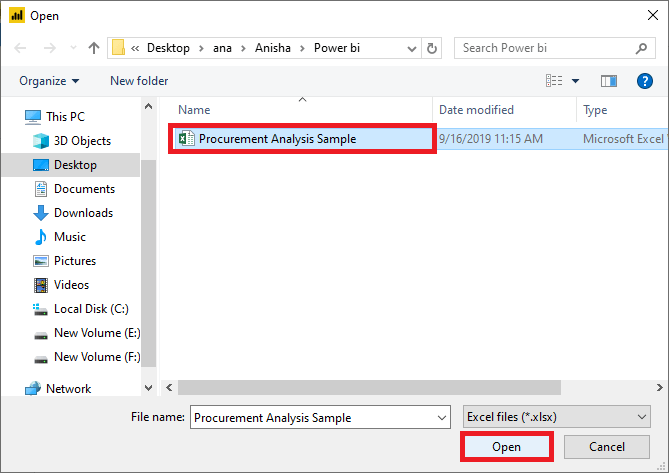
Step 3: And select the Excel dataset file to import the file.
ADVERTISEMENT
Advertisement report

Step 4: Select the procurement analysis sample file.
Step 5: And click on the Open button.
Step 6: For the exercise, select the Start button.

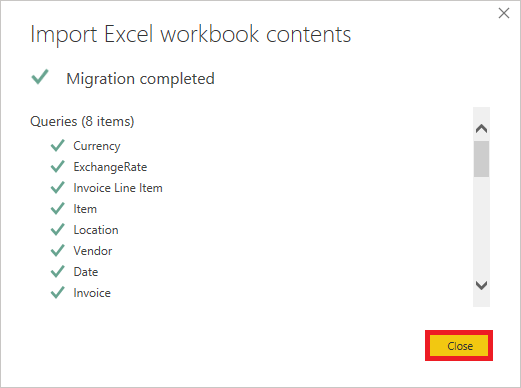
It starts import excel workbook and creating report view worksheets shown in the below screenshot.

Step 7: When the completed message appears, then select the Close button to dismiss it.
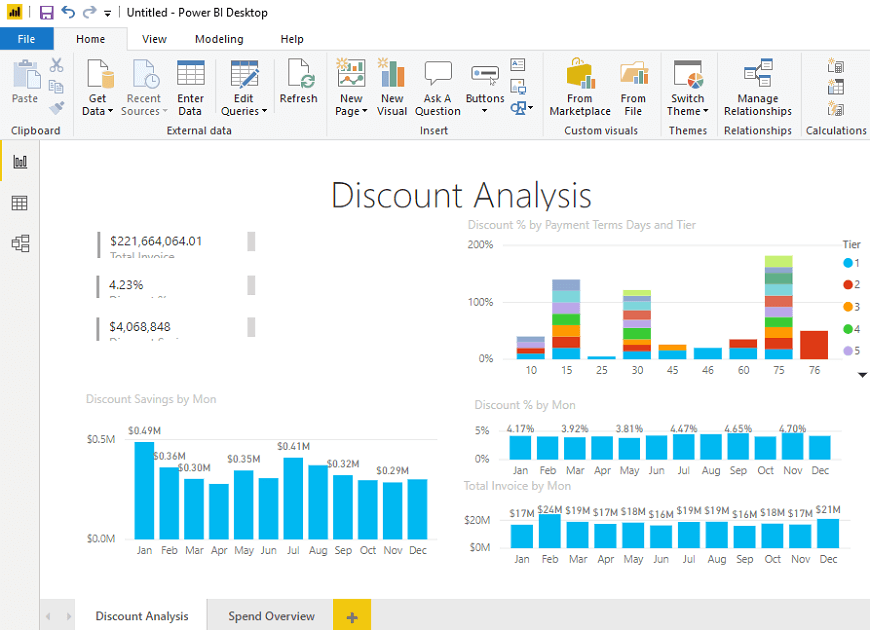
In the below screenshot, you can see the discount analysis of the imported dataset in the form of tiles.