We can do that using the “ggplot2” package.
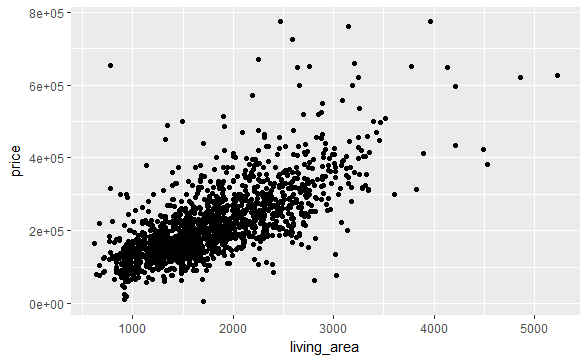
We’ll first make a scatter-plot with the help of geom_point() function, then we’ll make the linear model, by adding the geom_smooth() layer on top of it.
ggplot(data = house,aes(y=price,x=living_area))+geom_point()
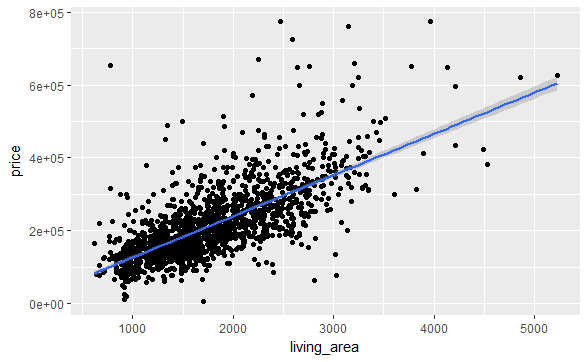
we’ll be adding the geom_smooth() layer on top of this, to fit a linear model.
ggplot(data = house,aes(y=price,x=living_area))+geom_point()+geom_smooth(method = "lm")