Viewing underlying SQL Queries in Tableau provides two options:
- Create a Performance Recording to record performance information about the main events you interact with workbook. Users can view the performance metrics in a workbook created by Tableau.
Help → Settings and Performance → Start Performance Recording
Help → Setting and Performance → Stop Performance Recording. - Reviewing the Tableau Desktop Logs located at C:\Users\My Documents\My Tableau Repository. For live connection to data source, you can check log.txt and tabprotosrv.txt files. For an extract, check tdeserver.txt file.
Step 1: Pick Your Visualization
Once you have the desired visualization created in Tableau, the first step is to select Help → Settings and Performance → Start Performance Recording from the Tableau toolbar.

Select Performance Recording
Step 2: Refresh Your Data
Then right click on the source in the Data toolbar and select ‘Refresh’. This will force Tableau to re-run the query.

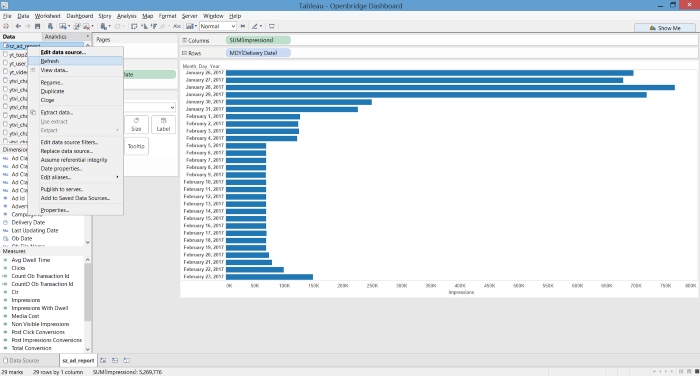
Select Refresh to re-run the query
Step 3: Stop Performance Recording
Once the query completes, select Help → Settings and Performance → Stop Performance Recording from the Tableau toolbar.


Stop Performance Recording
This should result in a new Tableau window opening with a workbook called ‘Tableau — PerformanceRecording’


Performance Recording Summary
Step 4: View Your Data
Right-click anywhere in the bar next to ‘Executing Query’ and select ‘View data’

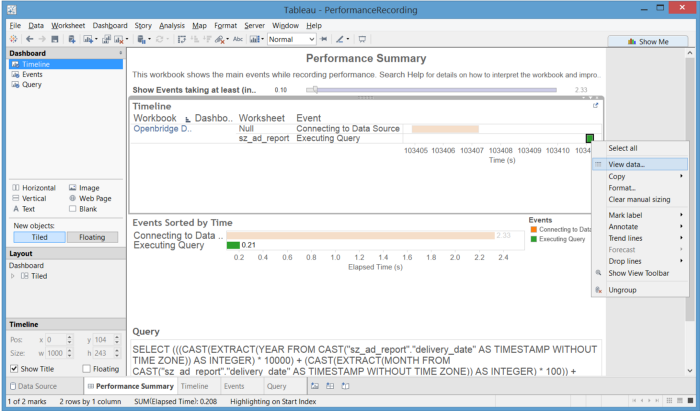
Select ‘View data…’
Step 5: Grab The SQL Query
If you click the ‘Underlying’ (Tableau v9.x) or ‘Full Data’ (Tableau v10.x) tab in the resulting pop-up window, you will see the SQL for the query in the ‘Command’ field.


Query View
You can select statement by highlighting the text in that field, select ‘Copy’ and either paste it directly into the SQL tool of your choice or into a text file for the time being.


Copy query
In our example, Tableau SQL statement looks like this…
SELECT (((CAST(EXTRACT(YEAR FROM CAST(“sz_ad_report”.”delivery_date” AS TIMESTAMP WITHOUT TIME ZONE)) AS INTEGER) * 10000) + (CAST(EXTRACT(MONTH FROM CAST(“sz_ad_report”.”delivery_date” AS TIMESTAMP WITHOUT TIME ZONE)) AS INTEGER) * 100)) + CAST(EXTRACT(DAY FROM CAST(“sz_ad_report”.”delivery_date” AS TIMESTAMP WITHOUT TIME ZONE)) AS INTEGER)) AS “md_delivery_date_ok”,SUM(“sz_ad_report”.”impressions”) AS “sum_impressions_ok”FROM “public”.”sz_ad_report” “sz_ad_report”WHERE ((“sz_ad_report”.”delivery_date” >= (TIMESTAMP ‘2017–01–26 00:00:00.000’)) AND (“sz_ad_report”.”delivery_date” < (TIMESTAMP ‘2017–02–25 00:00:00.000’)))GROUP BY 1
Step 6: Test Your SQL Query
You can then connect to a SQL tool like SQL Workbench using the same connection details you used in Tableau, paste the SQL statement into the ‘Statement’ tab and click the ‘Execute’ button.

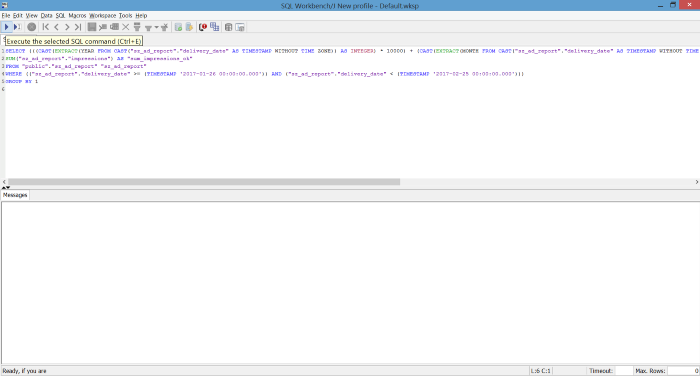
Test query
Step 7: Celebrate!
Voila! You should now see all the data used for the Tableau visualization in the ‘Results’ tab.

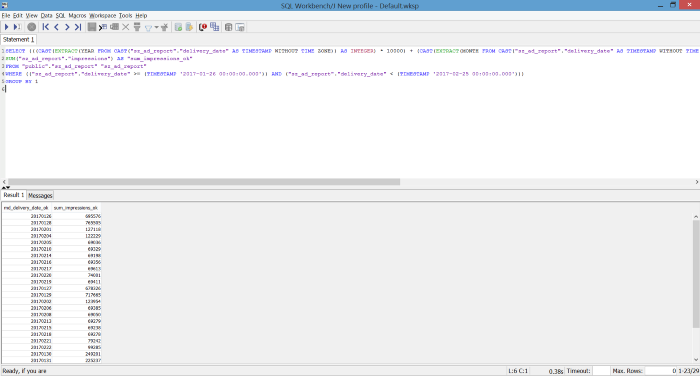
Query results
Now you can use this statement in other query tools without the need to worry about how to write SQL in Tableau from scratch, and save time!