There are many ways to create story in Tableau. Each story point can be based on a different view or dashboard, or the entire story can be based on the same visualization, just seen at different stages, with different marks filtered and annotations added. You can use stories to make a Business case or to simply narrate a sequence of events.
- Click the New Story tab.
- In the lower-left corner of the screen, choose a size for your story. Choose from one of the predefined sizes, or set a custom size, in pixels.
- By default, your story gets its title from its sheet name. To edit it, double-click the title. You can also change your title’s font, color, and alignment. Click apply to view your changes.
- To start building your story, drag a sheet from the Story tab on the left and drop it into the center of the view.
- Click Add a caption to summarize the story point.
- To highlight a key takeaway for your viewers, drag a text object over to the story worksheet and type your comment.
- To further highlight the main idea of this story point, you can change a filter or sort on a field in the view, then save your changes by clicking Update above the navigator box.
A story is a very powerful thing. It can influence its viewers and make them change their minds. It can take them through a journey that moves from various highs and lows and ends at a point that the storyteller wants. A story can also shock and surprise its viewers and provide them all the information they need to make the necessary decisions. That is why a story is an extremely important part of Tableau.
How to create a Story?
Let’s see the various steps required to create a Story in Tableau. This story uses the Superstore data set that is available as a sample on Tableau Desktop.
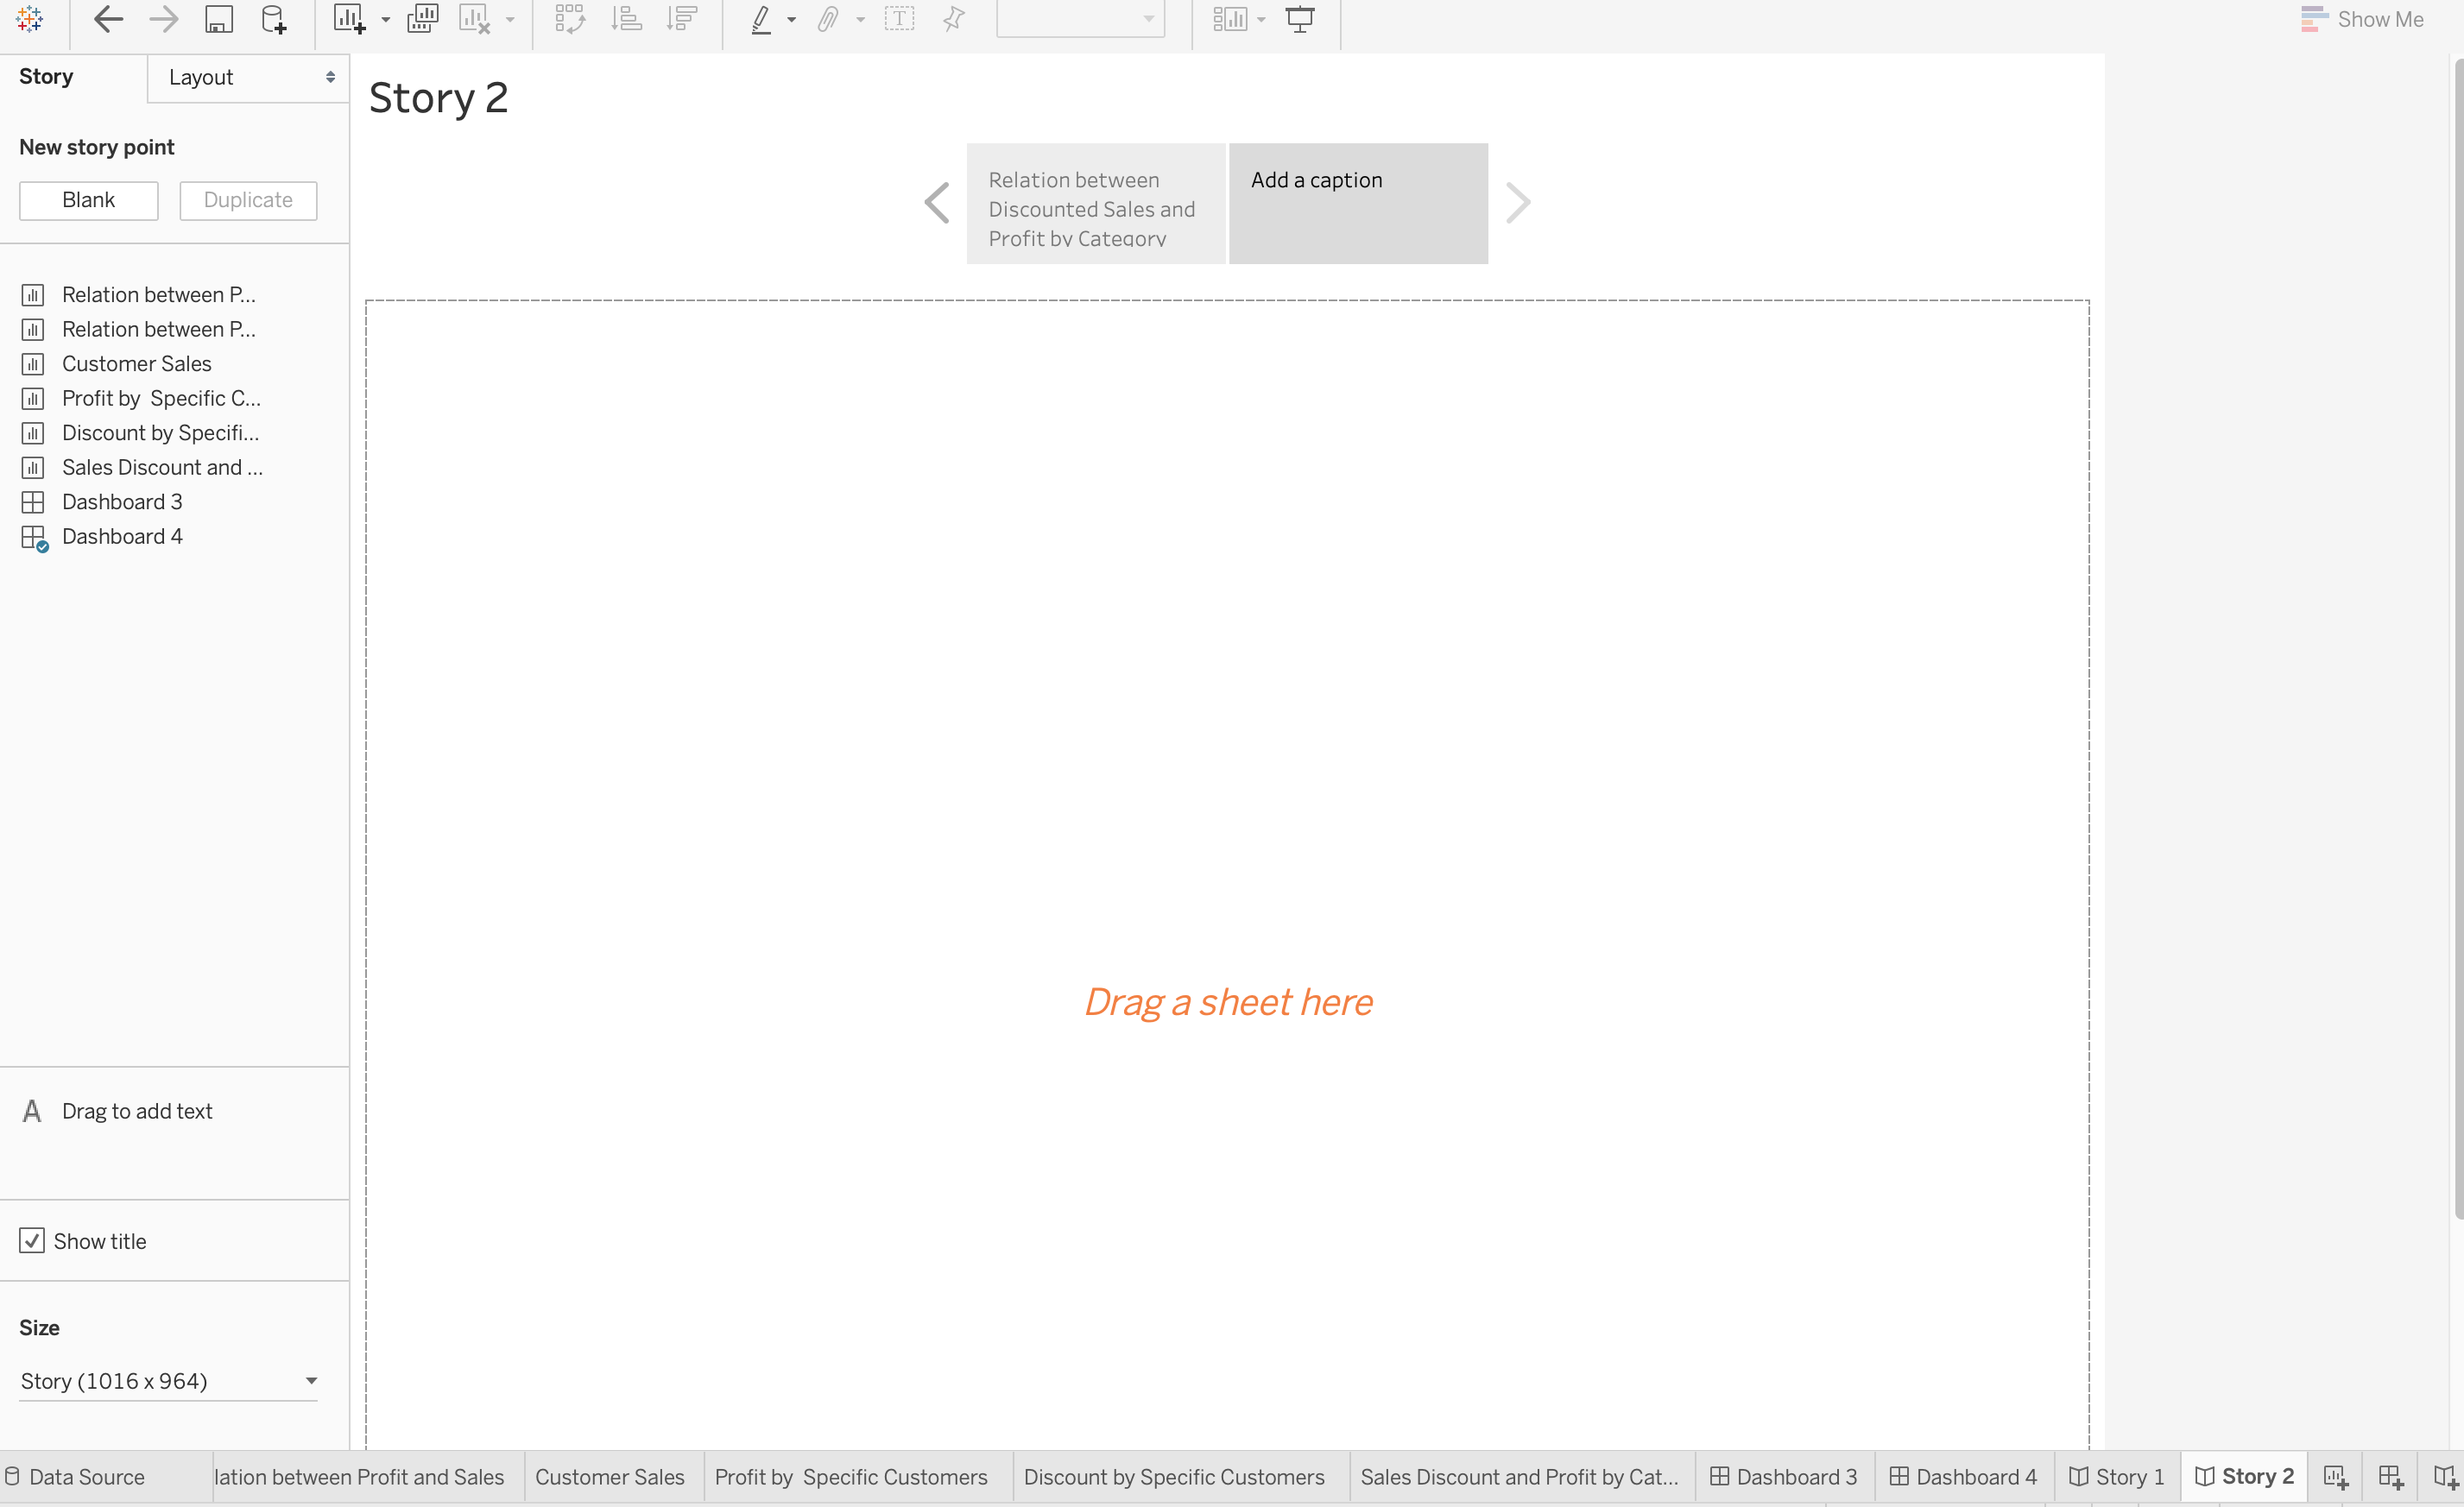
Step 1: Click on the new Story tab to create a new story. You can then add various sheets and dashboards to create a story point.

Step 2: You can double-click on the sheets and dashboards on the left to add them to a story point. You can also drag the sheets into your story point on the Tableau desktop. All the sheets and dashboards that are added to a story are connected to their original forms. So any changes made to the original sheets or dashboards are reflected in the story. For example, let’s add a dashboard containing the relation between Discounted Sales and Profit by Category to the story.
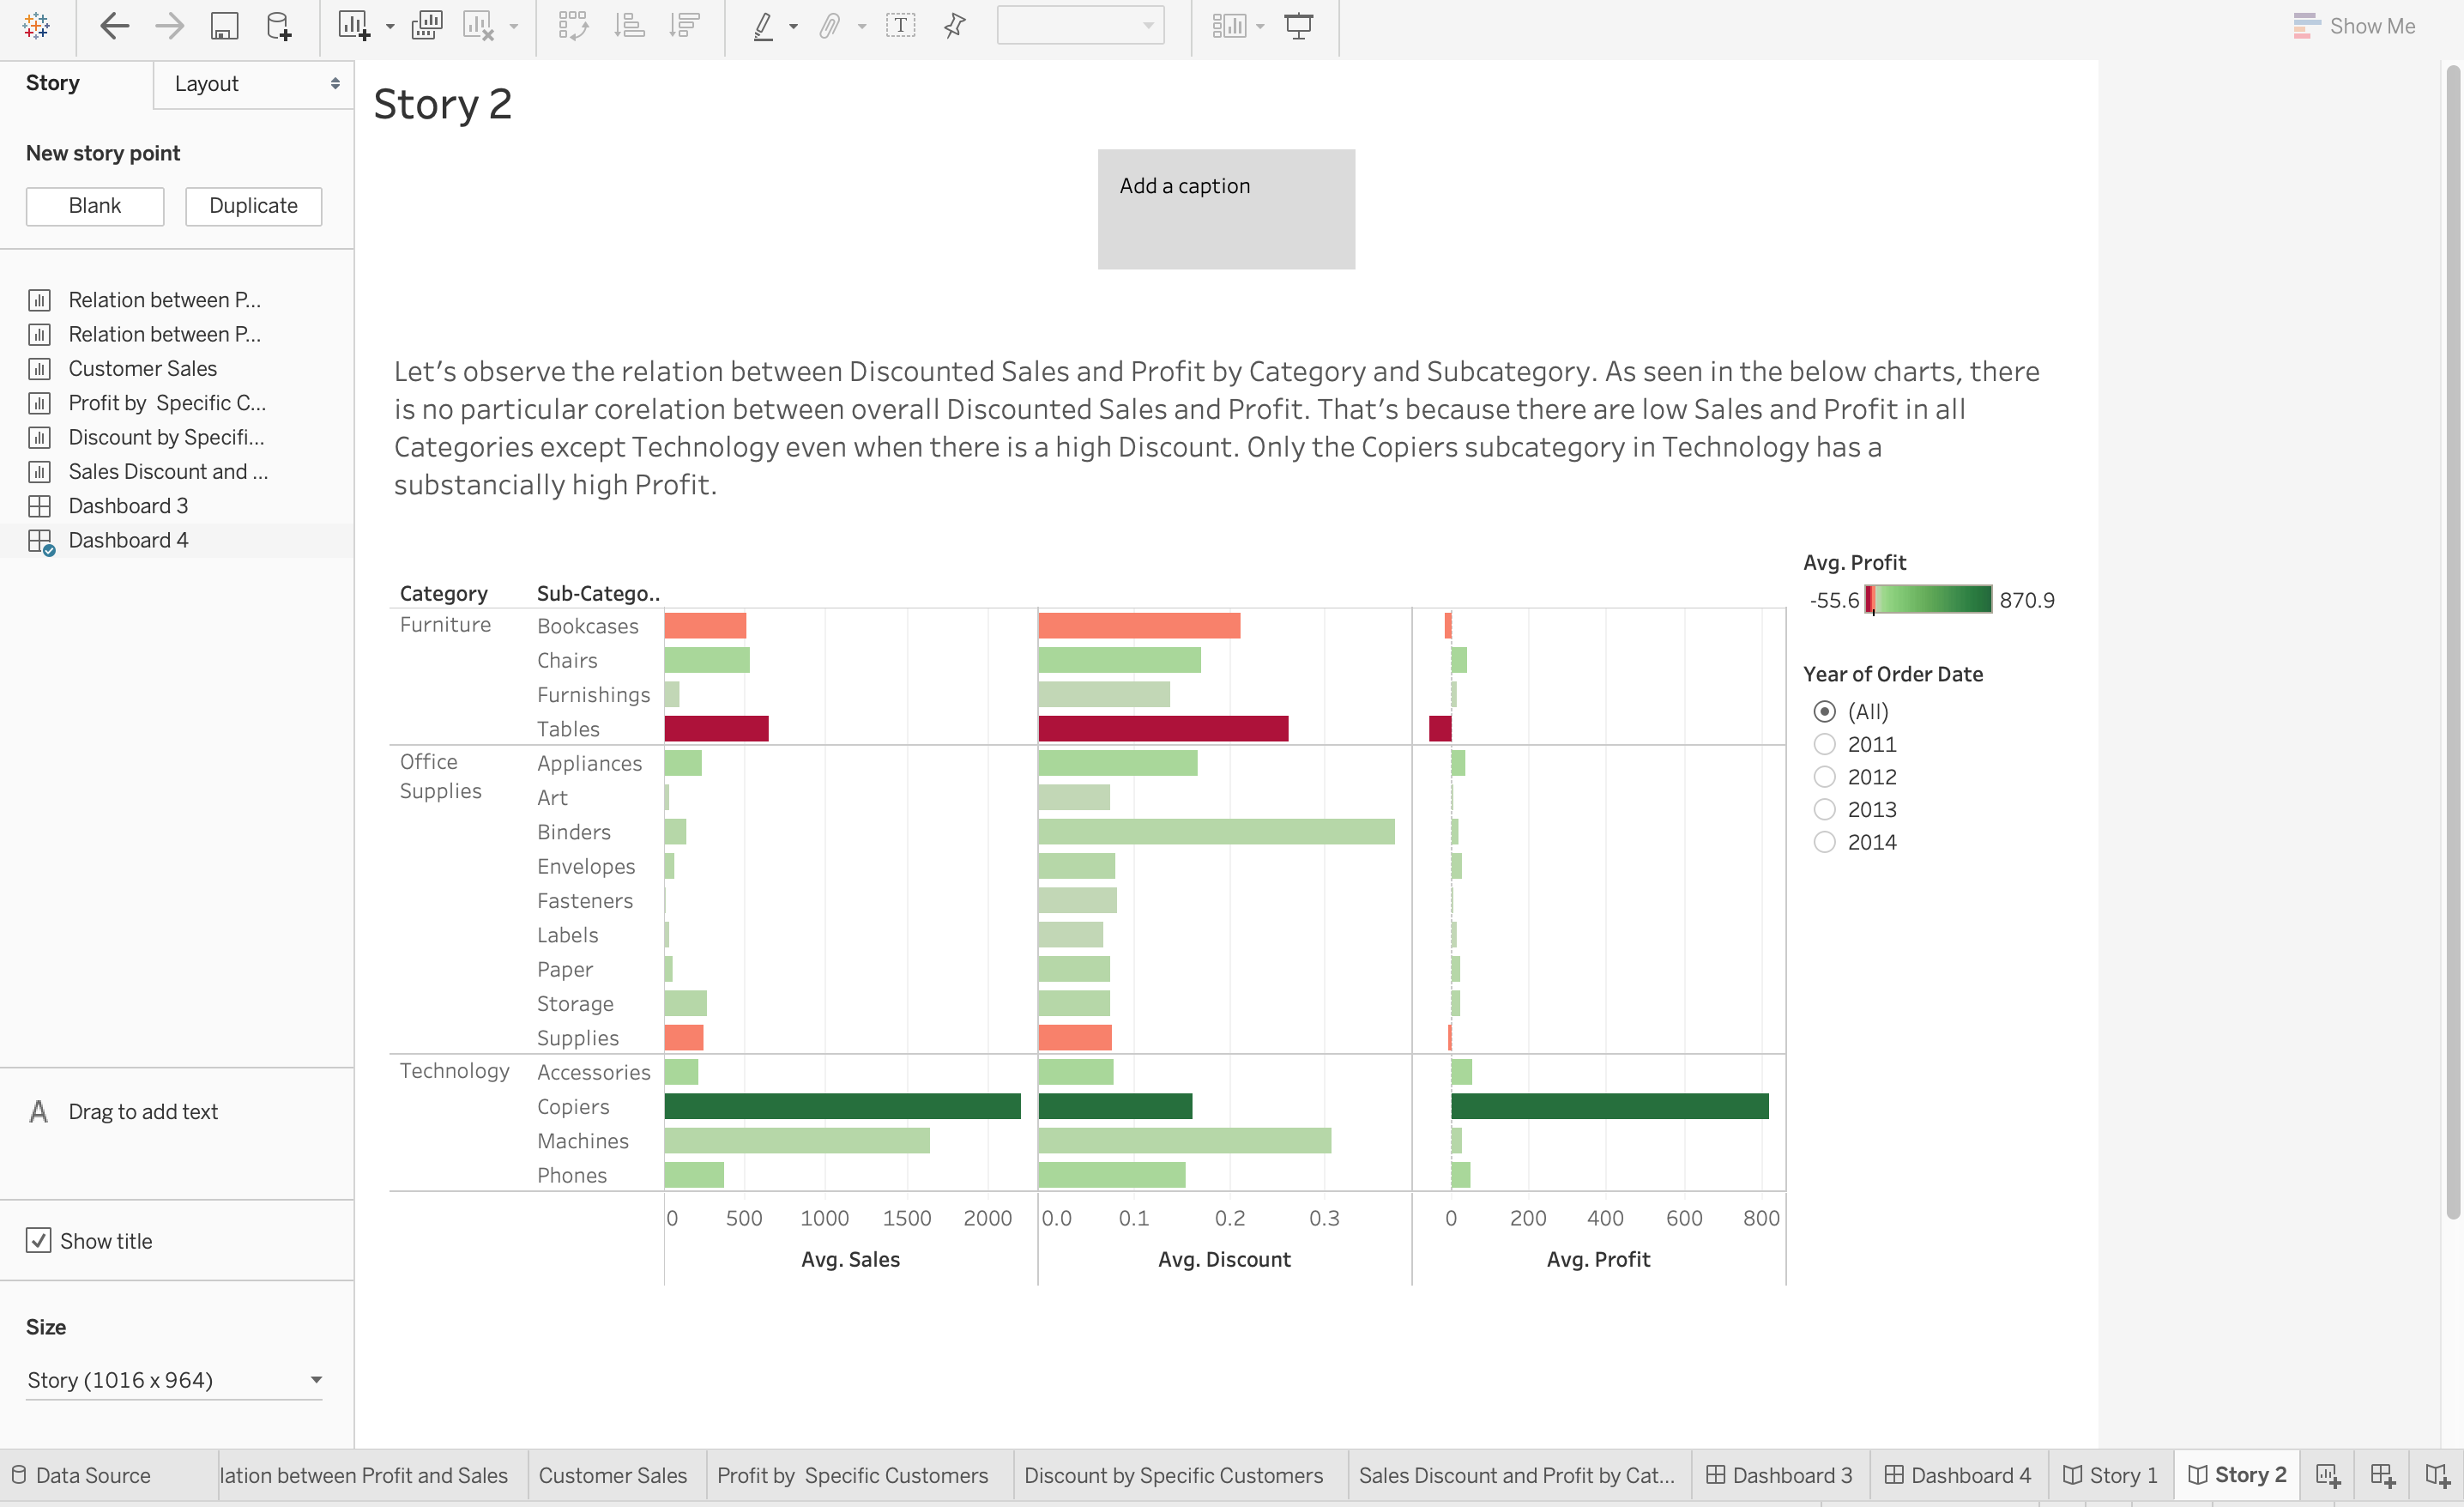
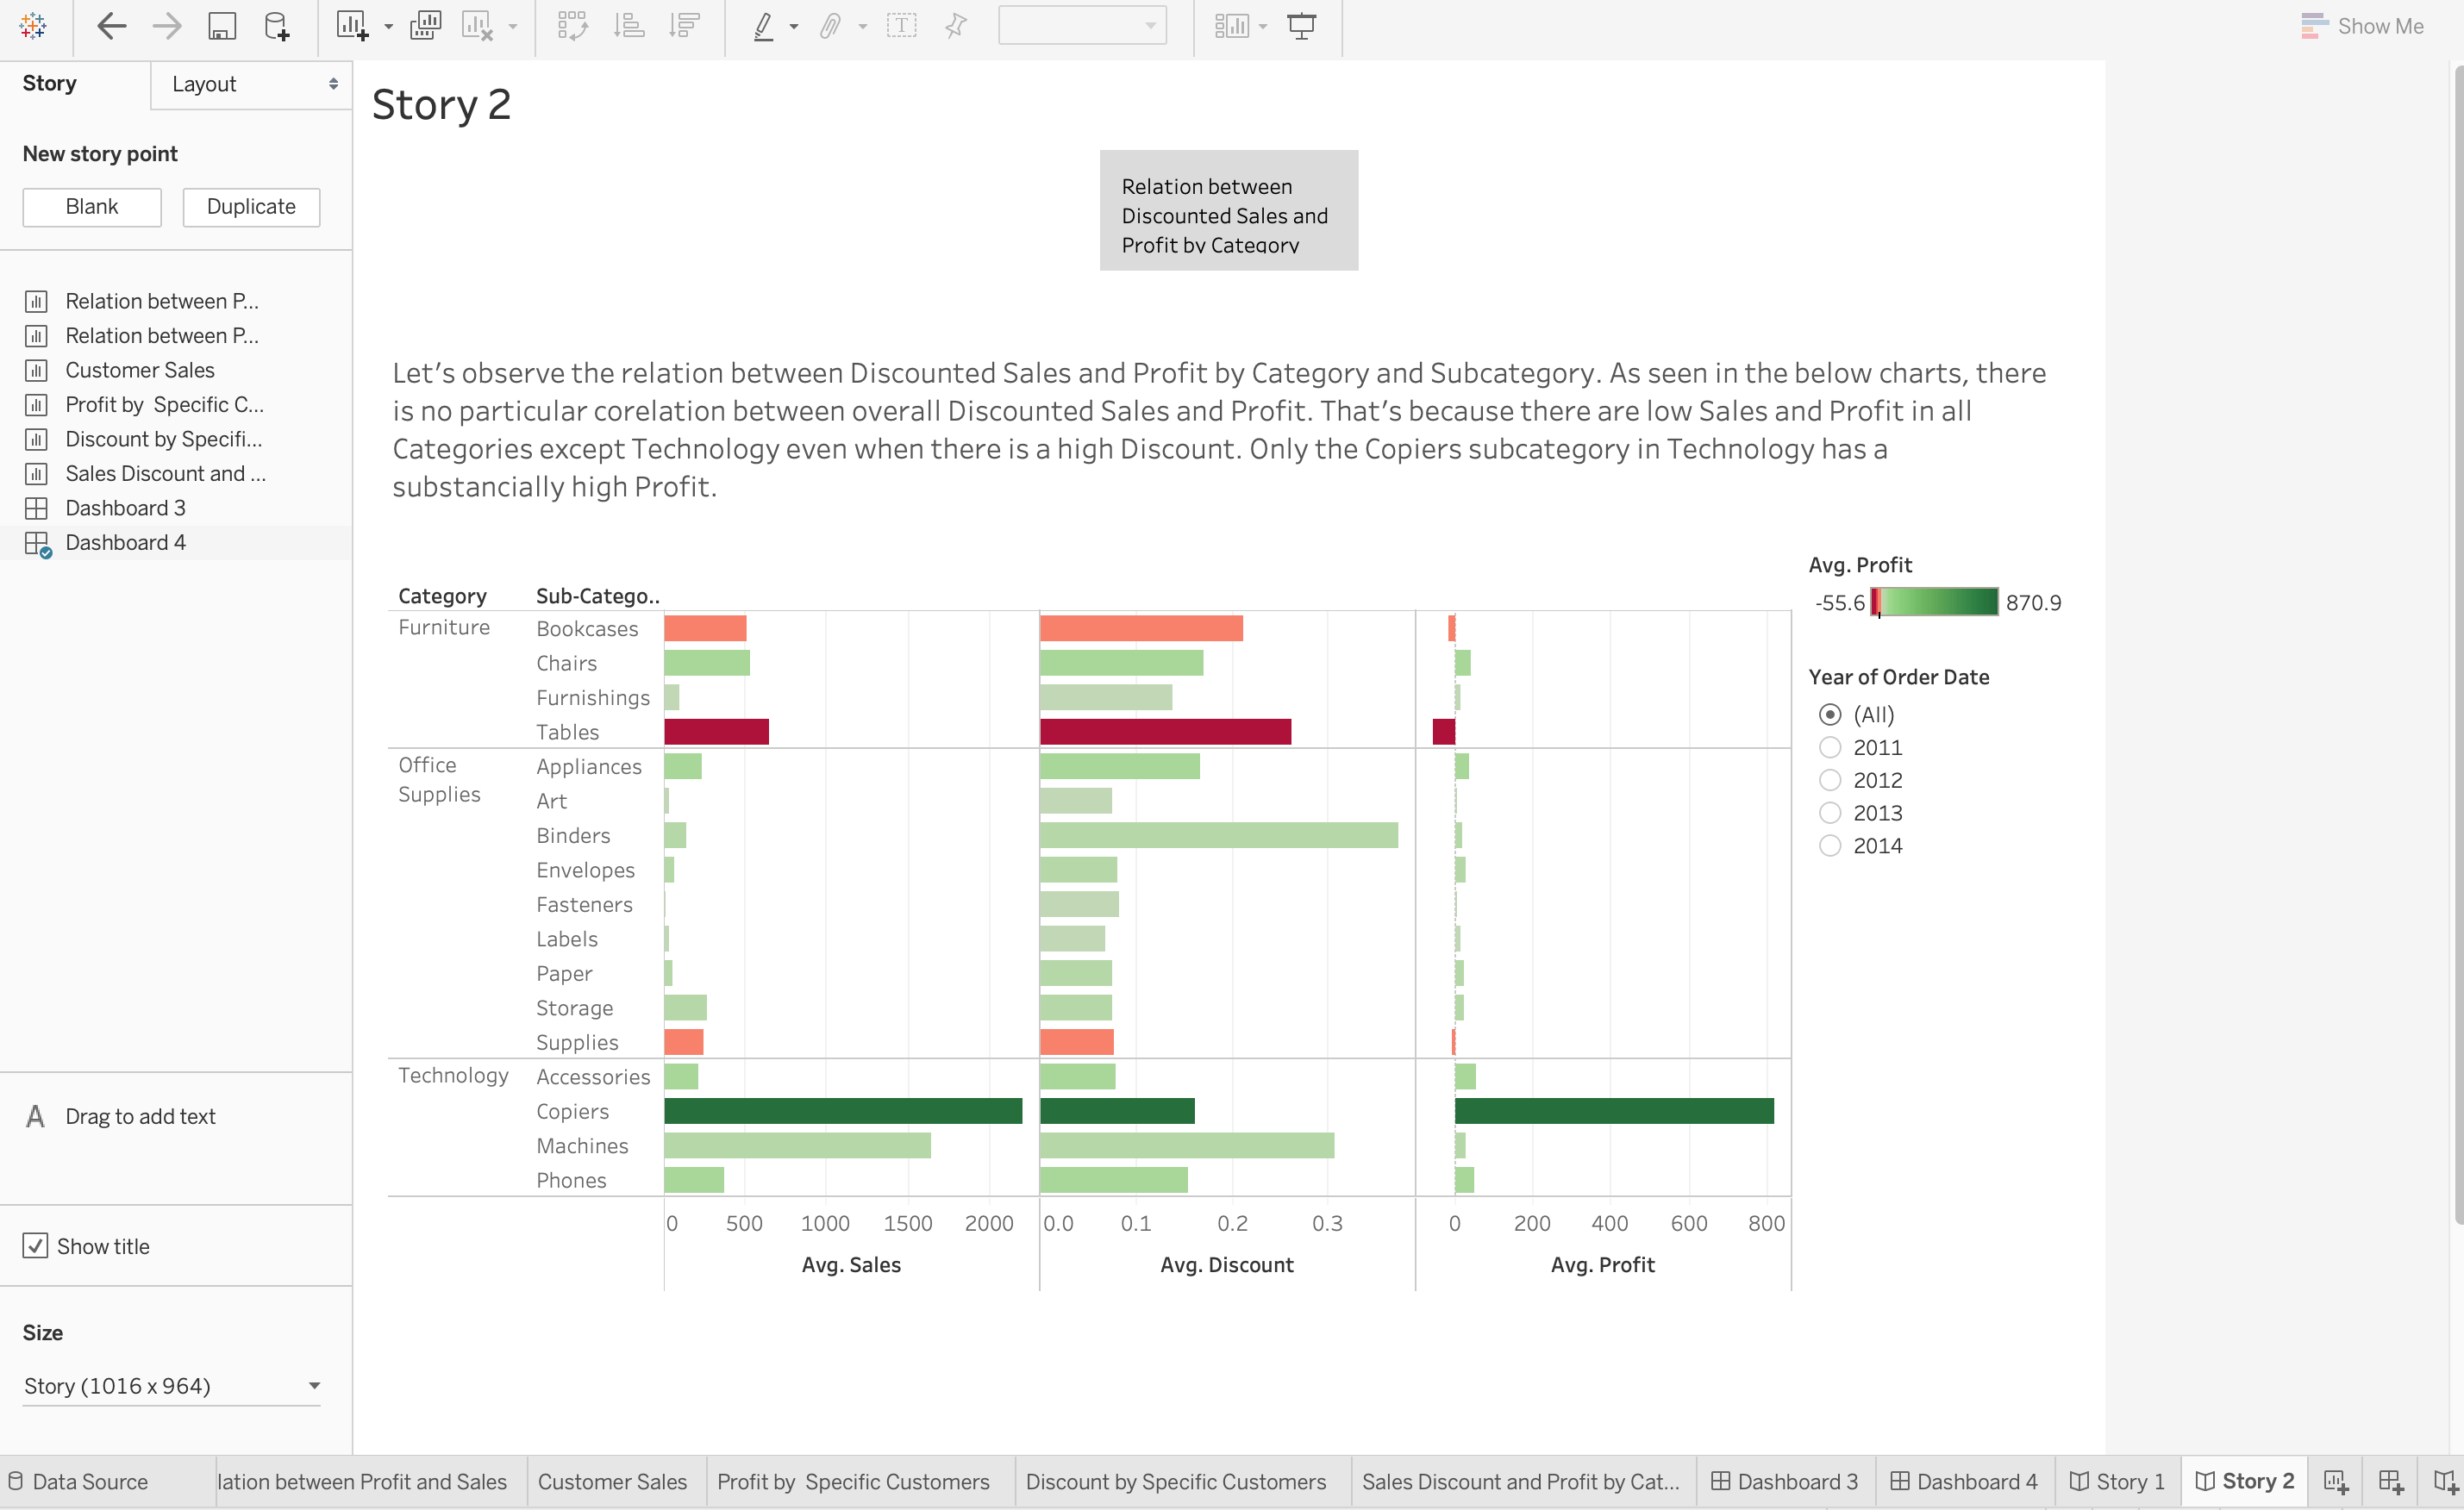
Step 3: We can also add a caption to summarize the story point by clicking on “Add a caption” and then writing it. Let’s add the caption “Relation between Discounted Sales and Profit by Category and Subcategory” to our example.
Step 4: It is possible to add another story point by 2 methods. You can either click on the Blank tab to use a blank sheet for the next story point or click on the Duplicate tab to obtain a duplicate sheet as the current story point. Let’s click on the blank option.
Step 5: You can change the size of your story by clicking on the Size option in the lower-left corner. You can choose from one of the predefined sizes or set your custom size in pixels. You can also change the name of your story by right-clicking on your Story tab and choosing rename.
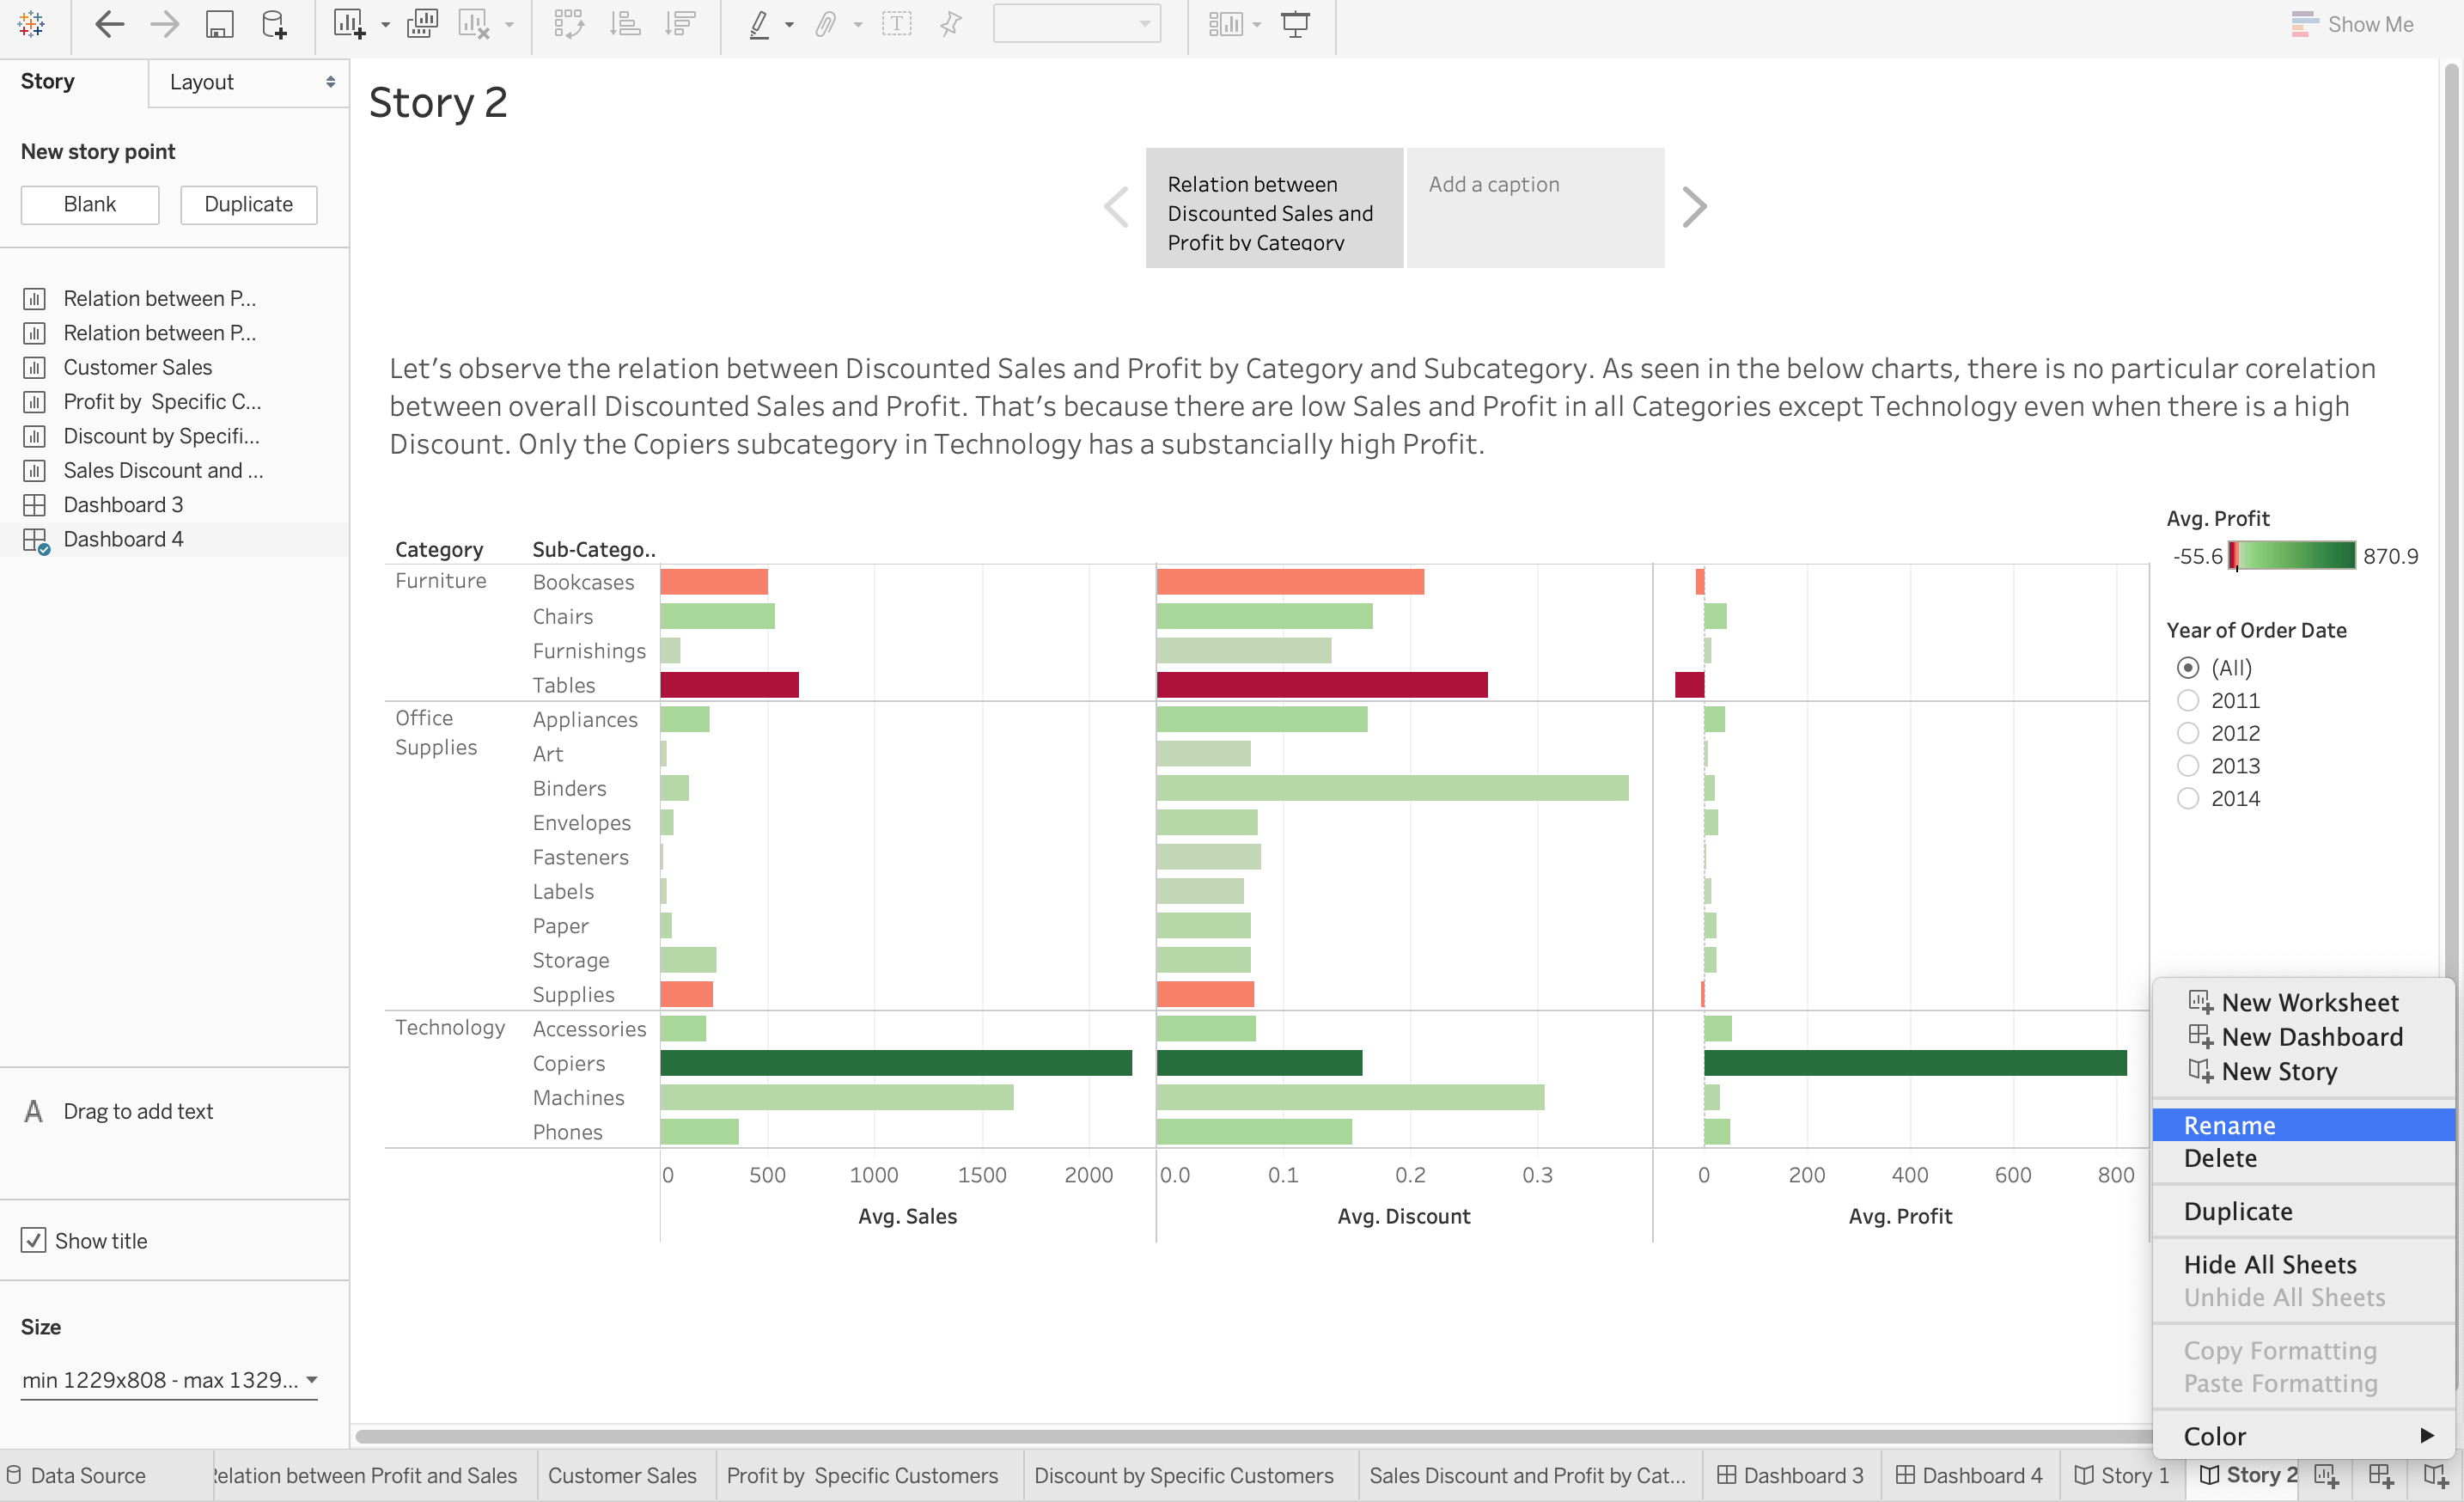
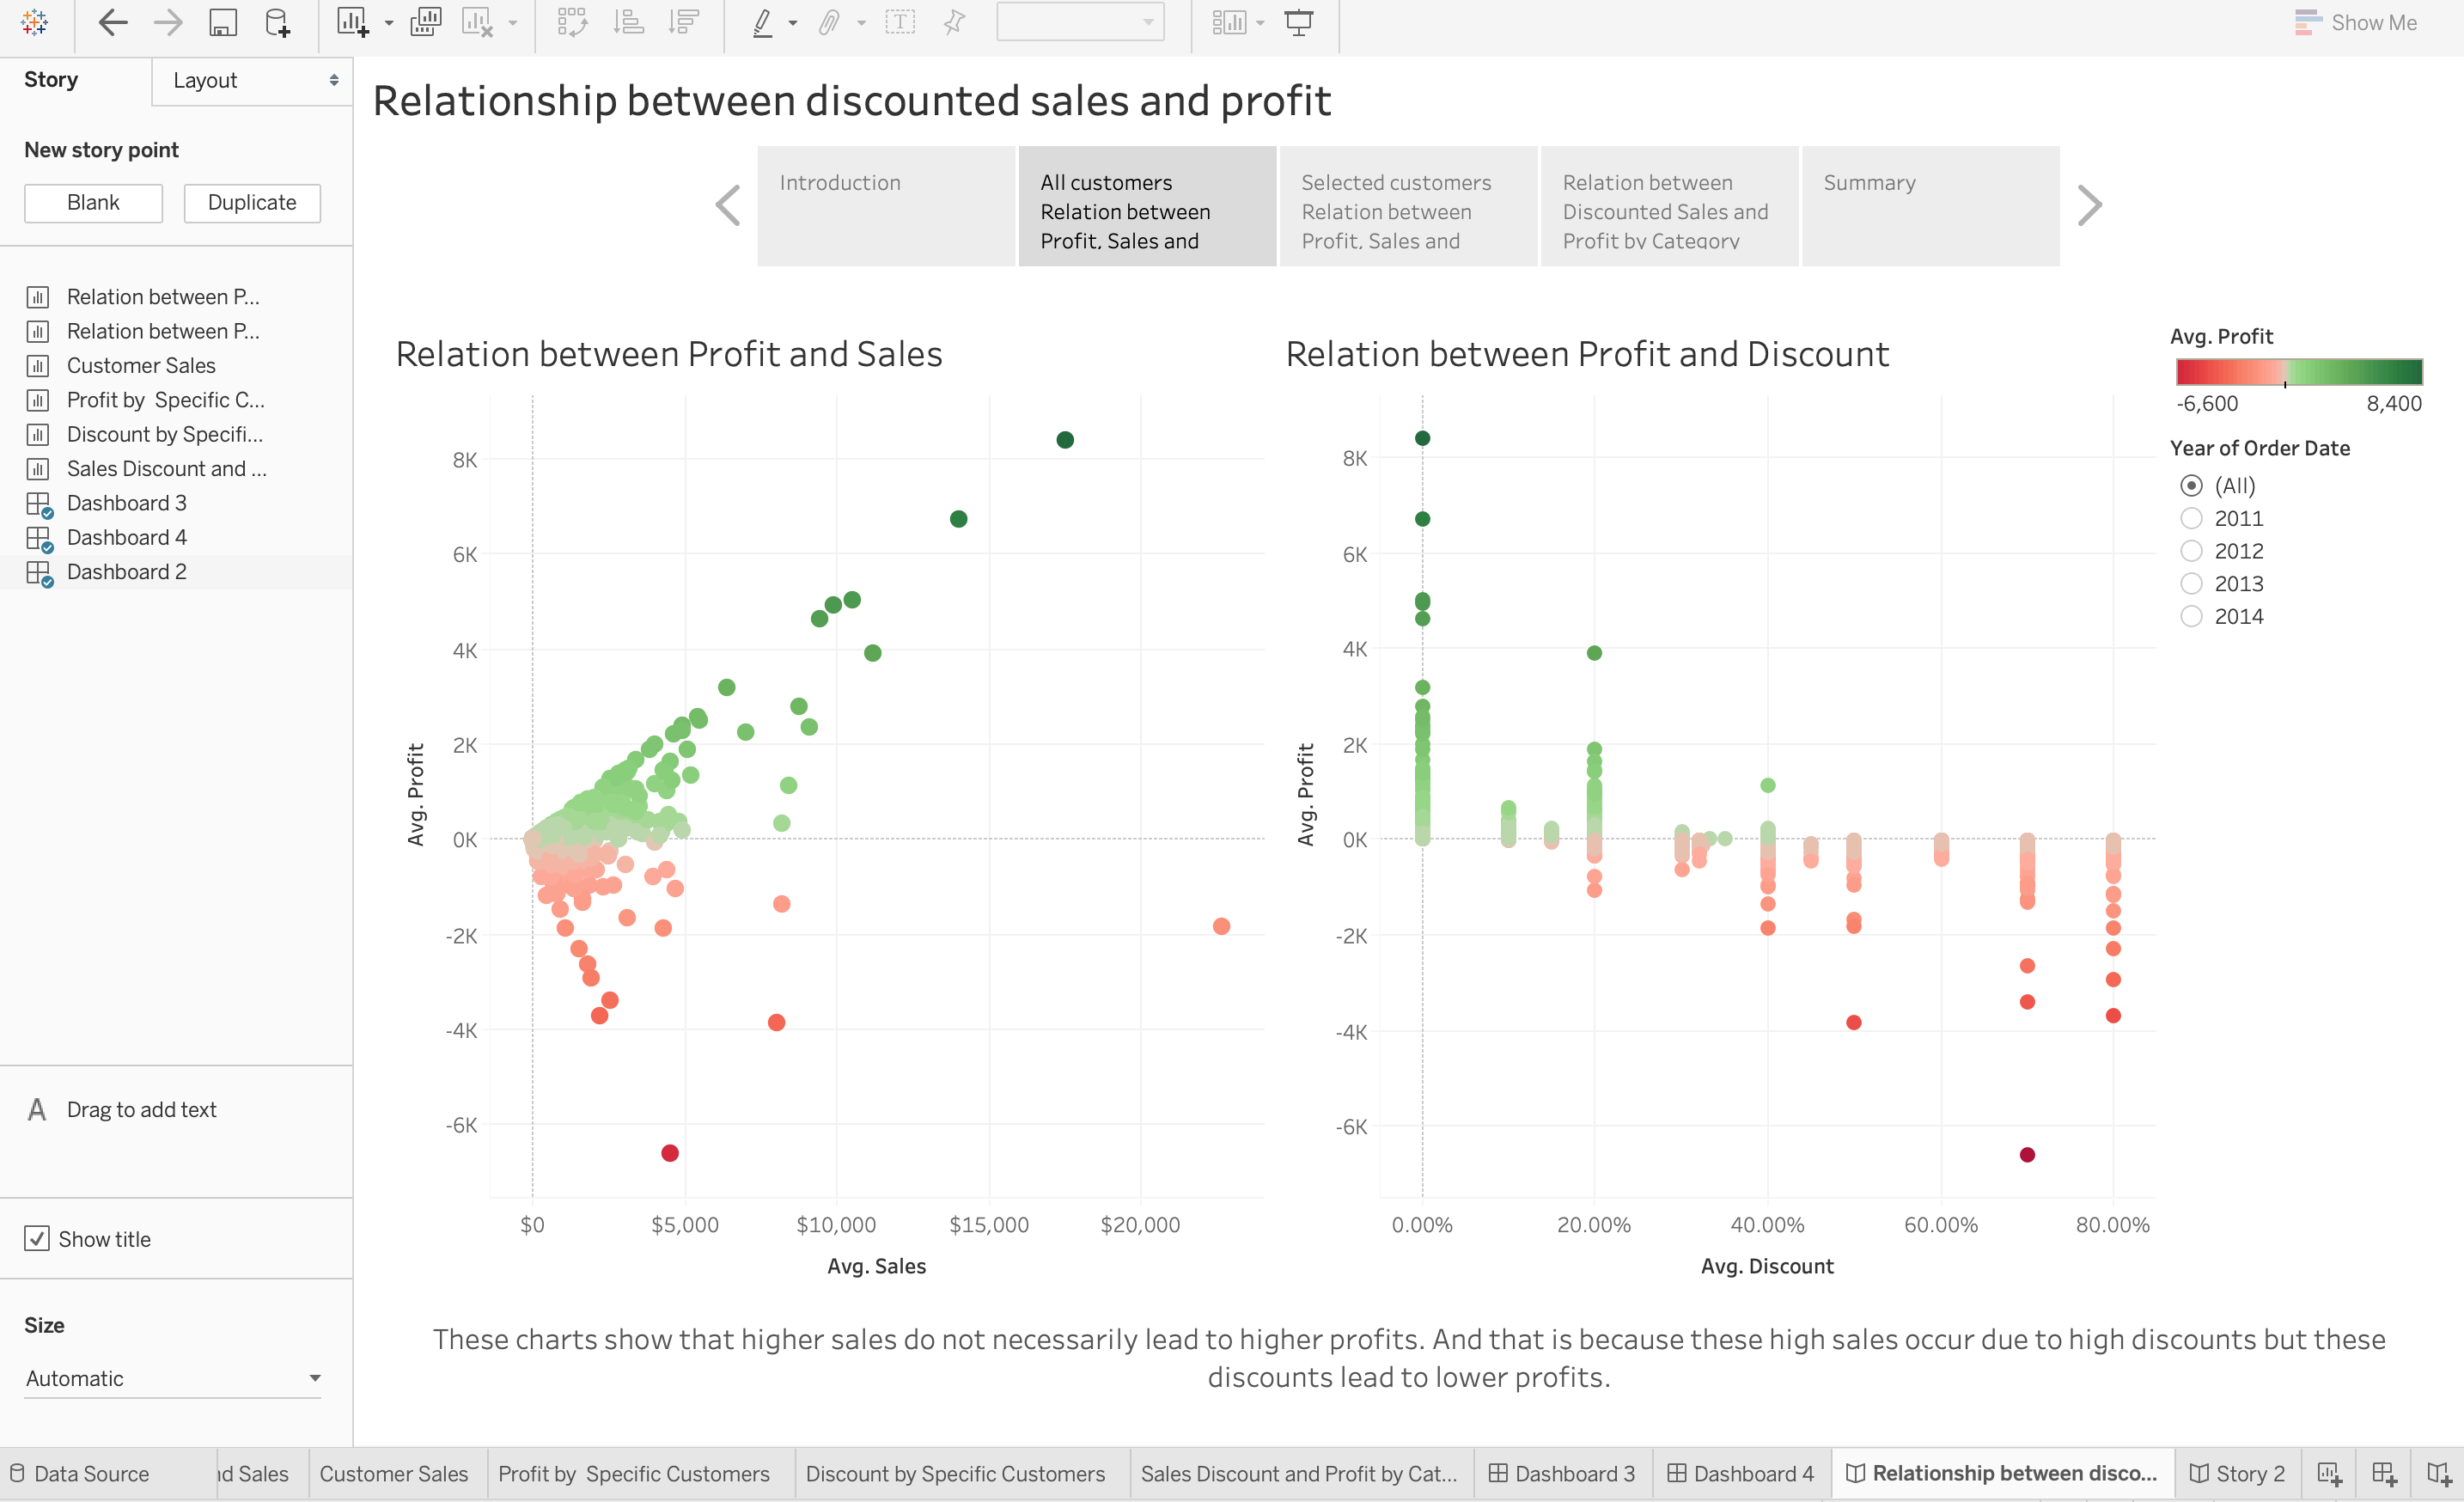
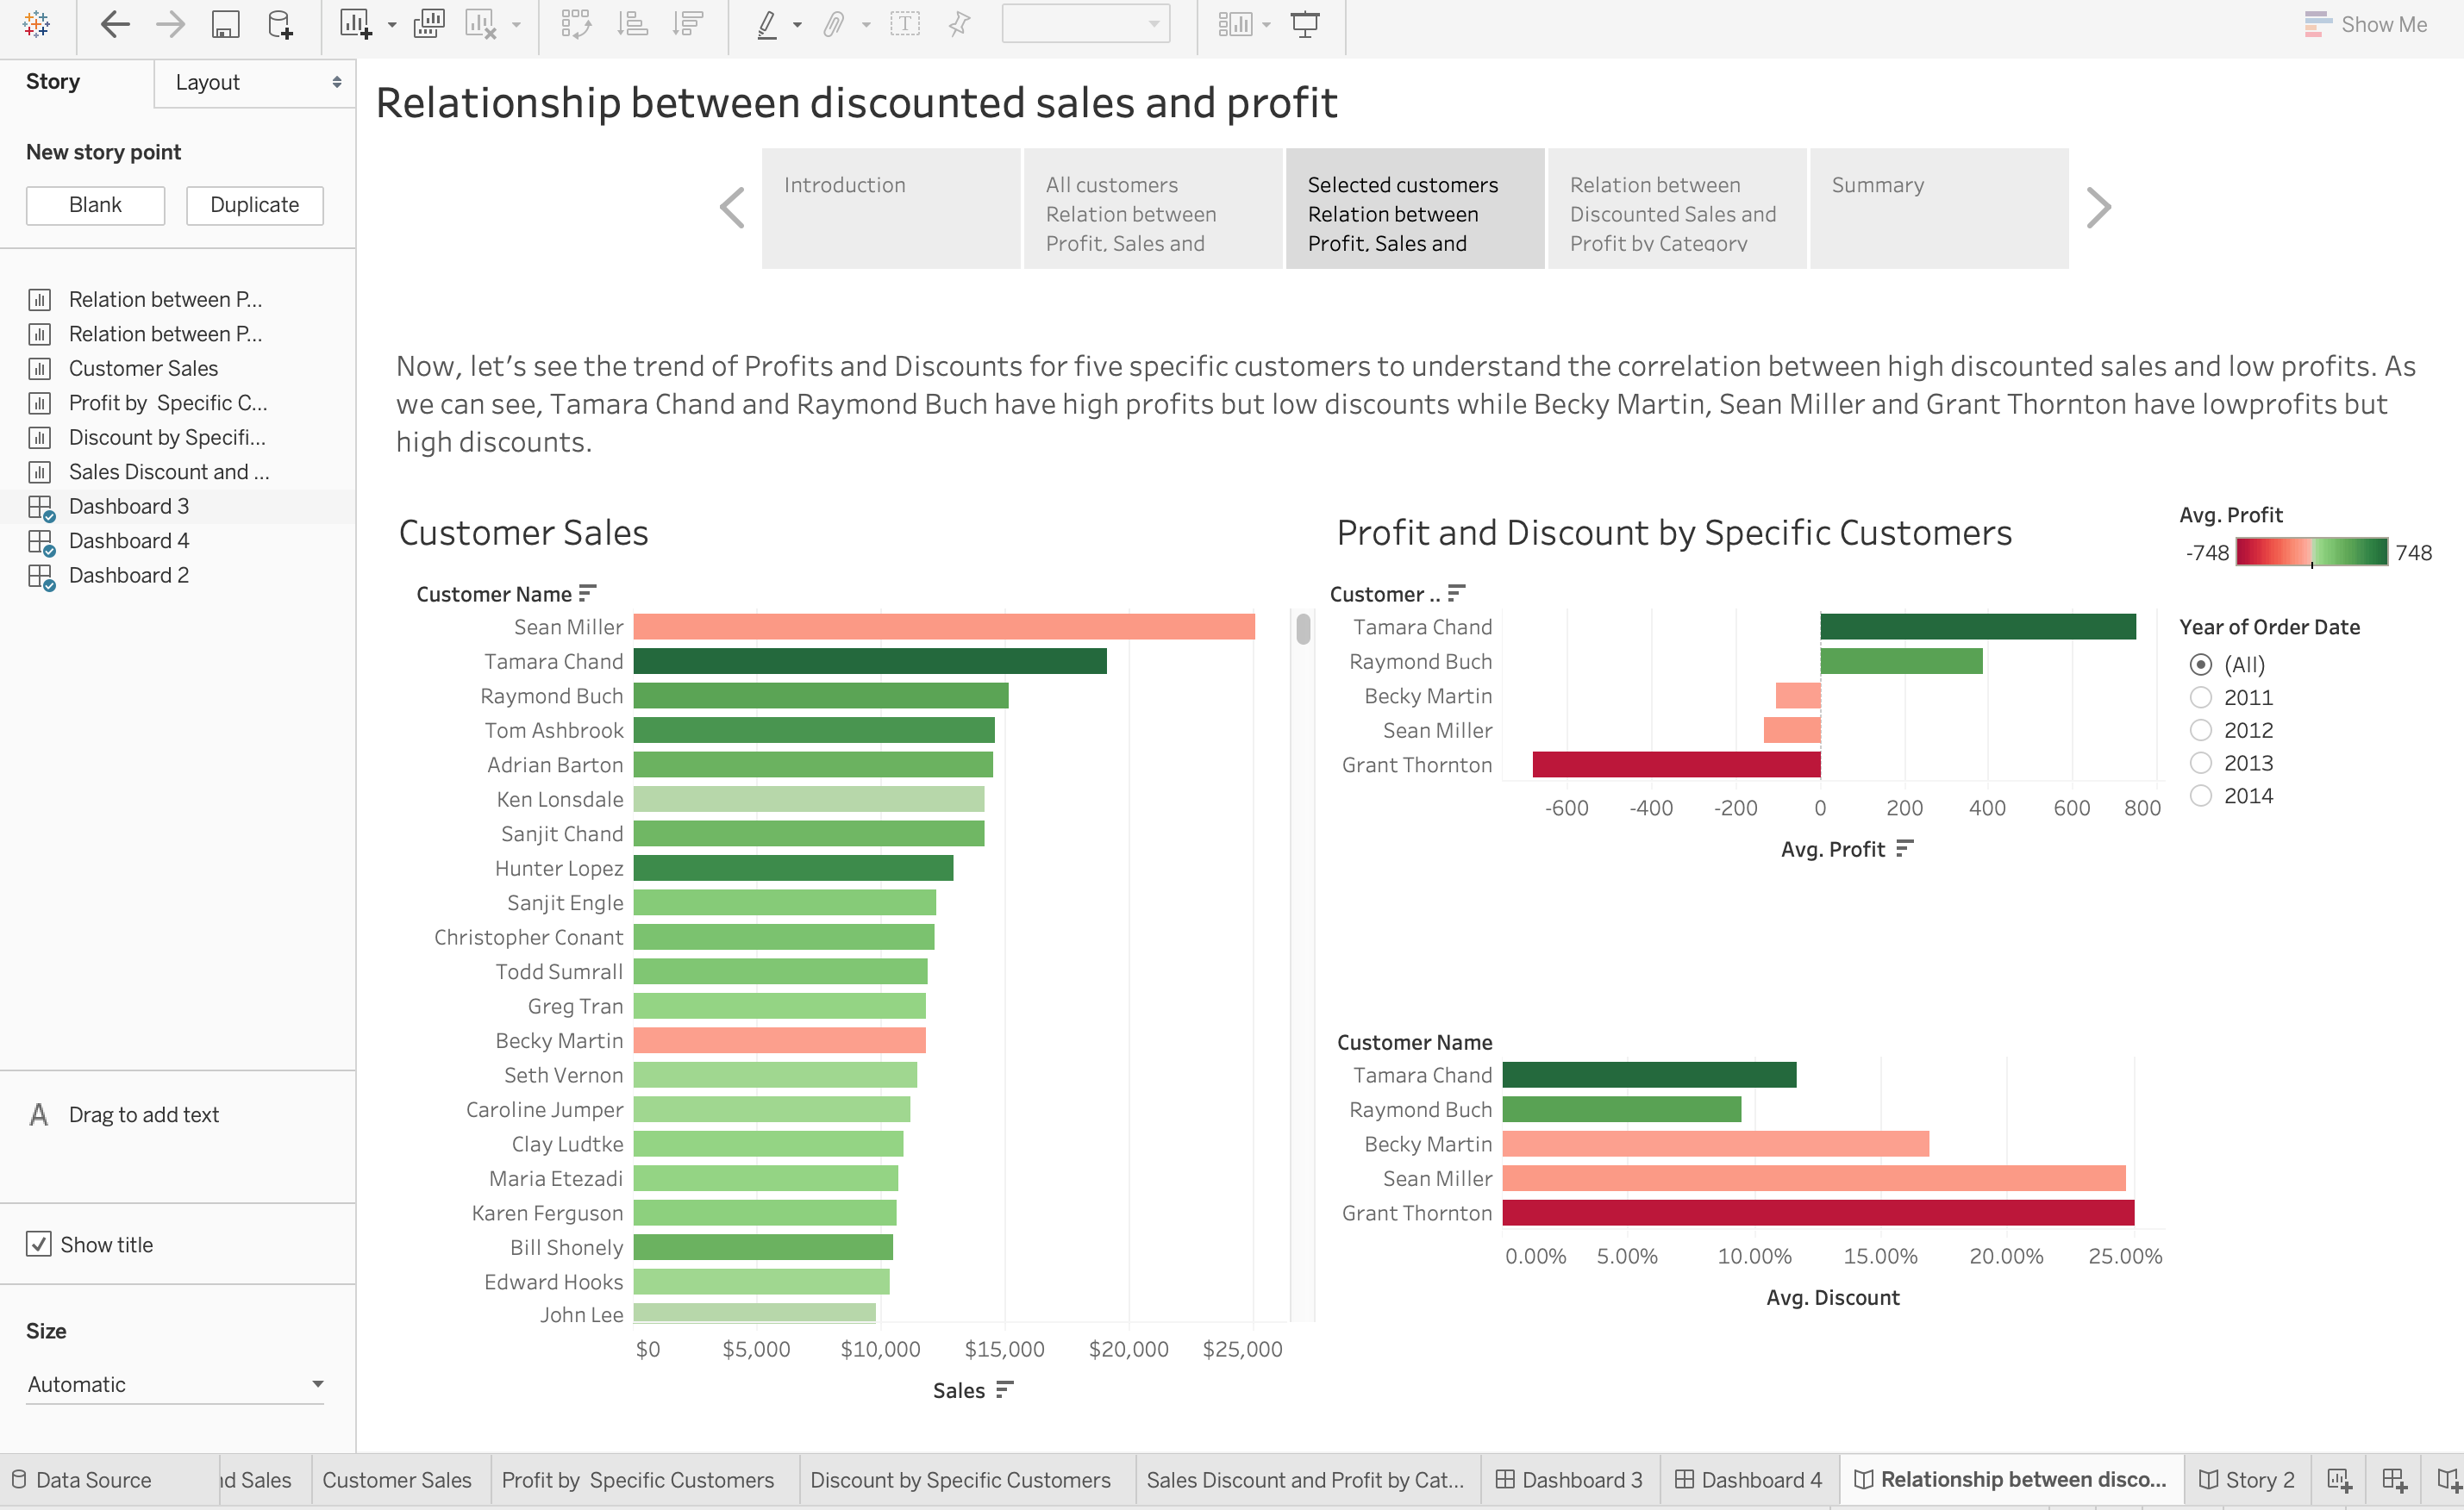
Step 6: Now, let’s see a complete story on the relationship between the discounted sales and profit