Joining terms is helpful when you are combining data from the same source. On the other hand, blending would require two completely defined data sources in your report.
Data Blending allows a combination of data from different data sources to be linked. Whereas, Data Joining works only with data from one and the same source. For example: If the data is from an Excel sheet and a SQL database, then Data Blending is the only option to combine the two types of data.
The major differences between the two are:
- Data Blending allows a combination of data from different data sources to be linked. Whereas, Data Joining works only with data from one and the same source.
For example: If the data is from an Excel sheet and a SQL database, then Data Blending is the only option to combine the two types of data. However, if the data is from two Excel sheets, you can use either Data Blending or Data Joining to combine the data. - Data Blending is also the only choice available when ‘joining’ the tables is impractical. This impracticality occurs when the data set is humongous. When joins might create duplicate data or when using databases such as Salesforce and Cubes do not support Joins.Tableau considers the first data source as the primary data source for building the Viz. The other data sources are for consideration for providing more information. In the Data Area, a blue check mark denotes the Primary data Source and an Orange check mark denotes the Secondary data source.
 Orange and Blue colours to denote primary and secondary data sourceConsider a database containing details of a warehouse. One table contains the Store name and Size while the other contains the Store name and Sales. Now, if the user requires both the Size and Sales for display on the Viz, the user creates a relationship between the 2 data sources using Store name as the common field. Also, note the Measure values from the Secondary dataset are treated as discrete measures.
 - The final difference is that Data Blending happens within Tableau, but Data Joining happens outside Tableau.
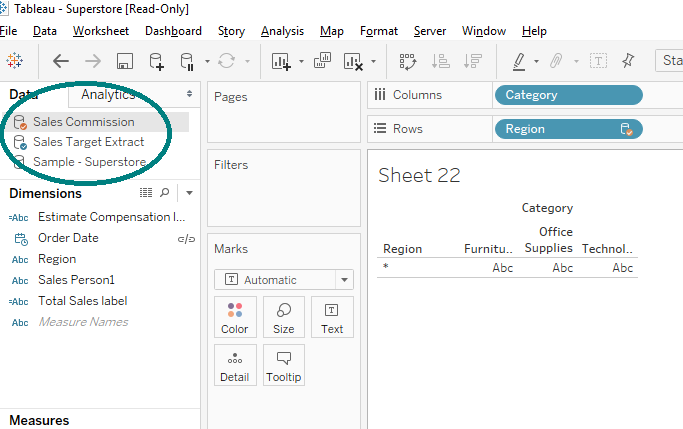
Data Blending in Tableau
Data Blending is not possible if there are no common fields available between the tables. Although, the fields need not have the exact same name. As long as at least one value matches, the fields can be linked to each other. If there are members which do not match, they are mapped to ‘null’.
For example, consider a data-set with temperatures and rainfall records over the past two years. One table might be a record of the temperature in all the cities in the U.S with a field name ‘City’ but the other table might be a record of the rainfall in all the cities using a field name ‘Region’. These two tables can blend using the ‘City’ field as the common field. Now, the ‘Temperature’ table is the primary table and the ‘Rainfall’ table is the secondary table. If there are different members, these members are displayed as ‘null’ values.
If the fields have different titles but have common members, the data sources can be linked by
- Right-clicking the field and renaming.
- Goto to the data menu → edit relationships → create a custom relationship.


Data Blending it is
On the basis of the summary of the differences between Data Blending and Data Joins in Tableau, it is certainly easy to comprehend why Data Blending wins on flexibility and features. So, now you can utilize Tableau to build a viz using data from different database sources as well.