Expected Value of Random Variables — Explained Simply
Along with worked through examples
The expected value of a random variable is the weighted average of all possible values of the variable. The weight here means the probability of the random variable taking a specific value.
What is the expected value of the length of a carrot? The random variable here is the length of a carrot. In this post, I will explain the ways to answer this question.

Photo by Charles Deluvio on Unsplash
Before going in detail, we should make the distinction between discrete and continuous random variables.
- Discrete random variables take finitely many or countably infinitely many values. The number of rainy days in a year is a discrete random variable.
- Continuous random variables take uncountably infinitely many values. For instance, the time it takes from your home to the office is a continuous random variable. Depending on how you measure it (minutes, seconds, nanoseconds, and so on), it takes uncountably infinitely many values.
Expected value of discrete random variables
Let’s start with a very simple discrete random variable X which only takes the values 1 and 2 with probabilities 0.4 and 0.6, respectively.

Note: The probabilities must add up to 1 because we consider all the values this random variable can take.
The expected value of this random variable, denoted by E[X],
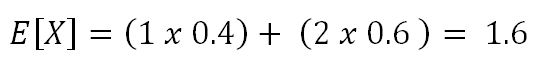
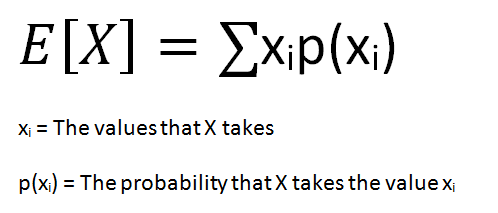
If the probabilities of 1 and 2 were the same, then the expected value would be 1.5. The formula for the expected value of a discrete random variable is:
You may think that this variable only takes values 1 and 2 and how could the expected value be something else? Consider the broader scope. Let’s say we select 10 values from this random variable. The total expected value will be 16 (6 times 2 and 4 times 1).
Let’s do a slightly more complicated example. Consider you take a test that has 4 multiple-choice questions. Each question is worth 10 points and has 4 choices.
You randomly select a choice without even reading the questions. What is the expected value of the points you take from this test? You can answer this question without any complicated calculation. Since there are 4 choices, the probability of selecting the correct answer is 0.25. There are 4 questions so you are likely to answer 1 question (1 x 0.25) correctly which is worth 10 points.
Let’s also find the expected value with the formula and see if we get the same result. We can answer 0, 1, 2, 3, or 4 questions correctly. Thus, we have a discrete random variable that takes values 0, 10, 20, 30, and 40. I calculated the probabilities of each case below and wrote the points earned in each case.
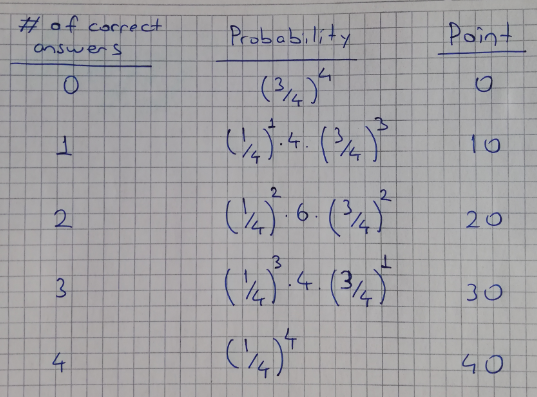
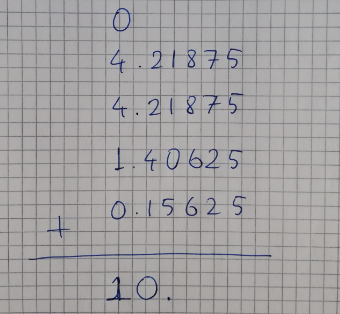
The expected value is calculated by multiplying the point (xi) and the probability of getting that point (p(xi)) and adding them up. If you actually go ahead and do the calculations, you will see that the result is 10.
Expected value of continuous random variables
The expected value of a continuous random variable is calculated with the same logic but using different methods. Since continuous random variables can take uncountably infinitely many values, we cannot talk about a variable taking a specific value. We rather focus on value ranges.
In order to calculate the probability of value ranges, probability density functions (PDF) are used. PDF is a function that specifies the probability of a random variable taking value within a particular range.
Here is the PDF of a continuous random variable that is uniformly distributed between 5 and 10. The x-axis contains all possible values and the y-axis shows the probability of values.

Uniformly distributed continuous random variable between 5 and 10
Since the variable has uniform distribution, the probability is the same for all values. The area under the entire PDF must be equal to 1. For the PDF above, the area is 0.2 x (10–5) which is equal to 1. Not every PDF is a straight line. In general, the area is calculated by taking the integral of the PDF.
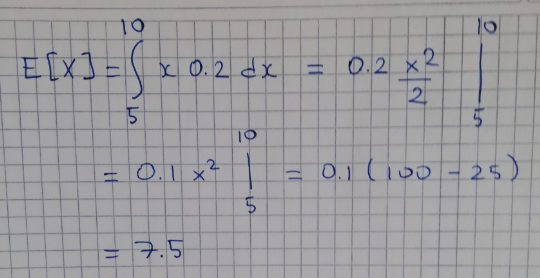
The expected value of this random variable is 7.5 which is easy to see on the graph. However, it is better to learn the formula since not every PDF is as simple as the one above.
The formula for the expected value of a continuous variable is:
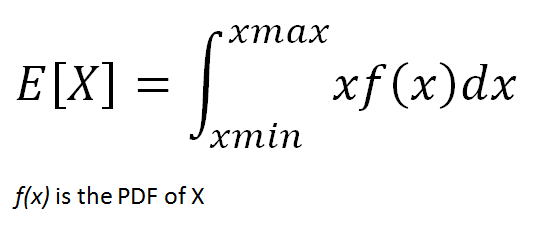
Based on this formula, the expected value is calculated as below.
Let’s do a slightly more complicated example. Consider the following PDF of a continuous random variable X.
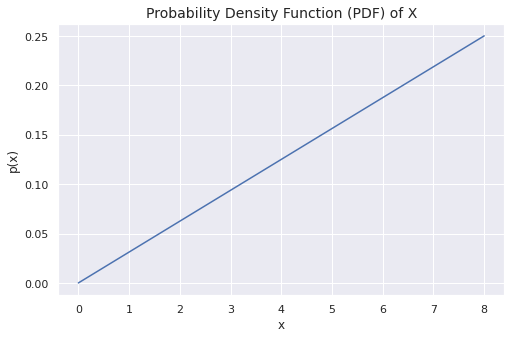
We will try to approach the expected value from a different perspective. The probability that the variable takes the value 0 is 0. The probability keeps increasing as the value increases and eventually reaching the highest probability at value 8.
If this was a uniform random variable, the expected value would be 4. Since the probability increases as the value increases, the expected value will be higher than 4.
If you think of this PDF as a triangle-shaped uniform sheet of metal or any other material, the expected value is the x coordinate of the center of mass.
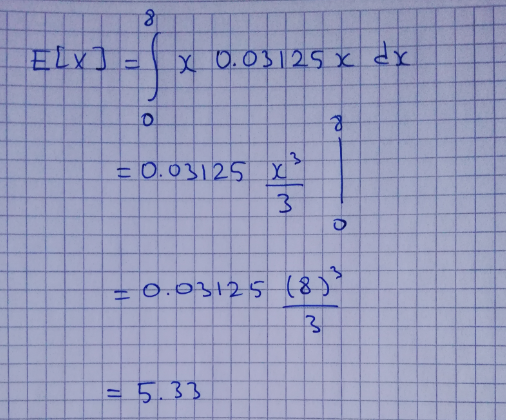
The PDF function represented by this line is f(x) = 0.03125x. The expected value turns out to be 5.33 if you do the math.
The expected value is a simple yet very fundamental concept in statistics and probability.