Data Science Interview Questions Part-4 (Unsupervised Learning)
Top-20 frequently asked data science interview questions and answers on Unsupervised Learning for fresher and experienced Data Scientist, Data analyst, statistician, and machine learning engineer job role.
Data Science is an interdisciplinary field. It uses statistics, machine learning, databases, visualization, and programming. So in this fourth article, we are focusing on unsupervised learning questions.
Let’s see the interview questions.
1. What is clustering?
Clustering is unsupervised learning because it does not have a target variable or class label. Clustering divides s given data observations into several groups (clusters) or a bunch of observations based on certain similarities. For example, segmenting customers, grouping super-market products such as cheese, meat products, appliances, etc.
2. What is the difference between classification and clustering?

3. What do you mean by dimension reduction?
Dimensionality reduction is the process of reducing the number of attributes from large dimensional data. There are lots of methods for reducing the dimension of the data: Principal Components Analysis(PCA), t-SNE, Wavelet Transformation, Factor Analysis, Linear Discriminant Analysis, and Attribute Subset Selection.
4. How the K-means algorithm work?
Kmeans algorithm is an iterative algorithm that partitions the dataset into a pre-defined number of groups or clusters where each observation belongs to only one group.

https://towardsdatascience.com/the-5-clustering-algorithms-data-scientists-need-to-know-a36d136ef68
K-means algorithm works in the following steps:
- Randomly initialize the k initial centers.
- Assigned observation to the nearest center and form the groups.
- Find the mean point of each cluster. Update the center coordinates and reassign the observations to the new cluster centers.
- Repeat steps 2–3 the process until the no change in the cluster observations.
5. How to choose the number of clusters or K in the k-means algorithm?
Elbow Criteria: This method is used to choose the optimal number of clusters (groups) of objects. It says that we should choose a number of clusters so that adding another cluster does not add sufficient information to continue the process. The percentage of variance explained is the ratio of the between-group variance to the total variance. It selects the point where marginal gain will drop.

https://en.wikipedia.org/wiki/Elbow_method_(clustering)
You can also create an elbow method graph between the within-cluster sum of squares(WCSS) and the number of clusters K. Here, the within-cluster sum of squares(WCSS) is a cost function that decreases with an increase in the number of clusters. The Elbow plot looks like an arm, then the elbow on the arm is an optimal number of k.

6. What are some disadvantages of K-means?
There are the following disadvantages:
- The k-means method is not guaranteed to converge to the global optimum and often terminates at a local optimum.
- The final results depend upon the initial random selection of cluster centers.
- Needs the number of clusters in advance to input the algorithm.
- Not suitable for convex shape clusters.
- It is sensitive to noise and outlier data points.
7. How do you evaluate the clustering algorithm?
The cluster can be evaluated using two types of measures intrinsic and extrinsic evaluation parameters. Intrinsic does not consider the external class labels while extrinsic considers the external class labels. Intrinsic cluster evaluation measures are the Davie-Bouldin Index and Silhouette coefficient. Extrinsic evaluation measures are Jaccard and Rand Index.
8. How do you generate arbitrary or random shape clusters?
There are some clustering algorithms that can generate random or arbitrary shape clusters such as Density-based methods such as DBSCAN, OPTICS, and DENCLUE. Spectral clsutering can also generate arbitrary or random shape clusters.

9. What is Euclidean and Manhatten distance?
Euclidean measures the ‘as-the-crow-flies’ distance and Manhattan distance is also known as a city block. It measures the distance in blocks between any two points in a city. (or city block).

Data mining by Jiawei Han; Micheline Kamber; JianPei

Euclidean Distance

10. Explain spectral clustering.
It is based on standard linear algebra. Spectral Clustering uses the connectivity approach to clustering. It easy to implement, faster especially for the sparse datasets, and can generate non-convex clusters. Spectral clustering kind of graph partitioning algorithm. The spectral algorithm works in the following steps.
- Create a similarity graph
- Create an Adjacency matrix W and Degree matrix D.
- The adjacency matrix is an n*n matrix that has 1 in each cell that represents the edge between nodes of the column and row. The degree matrix is a diagonal matrix where the diagonal value is the sum of all the elements in each row of the adjacency matrix.
- Create a Laplacian matrix L by subtracting the adjacency matrix from the degree matrix.
- Calculates the eigenvectors of the Laplacian matrix L and performs the k-means algorithm on the second smallest eigenvector.
11. What is tSNE?
t-SNE stands for t-Distributed Stochastic Neighbor Embedding which considers the nearest neighbors for reducing the data. t-SNE is a nonlinear dimensionality reduction technique. With a large dataset, it will not produce better results. t-SNE has quadratic time and space complexity.
The t-SNE algorithm computes the similarity between pairs of observations in the high dimensional space and low dimensional space. And then it optimizes both similarity measures. In simple words we can say, it maps the high-dimensional data into a lower-dimensional space. After transformation input features can’t be inferred from the reduced dimensions. It can be used in recognizing feature expressions, tumor detection, compression, information security, and bioinformatics.
12. What is principal component analysis?
PCA is the process of reducing the dimension of input data into a lower dimension while keeping the essence of all original variables. It used is used to speed up the model generation process and helps in visualizing the large dimensional data.

13. How will you decide the number of components in PCA?
There are three methods for deciding the number of components:
- Eigenvalues: you can choose the number of components that have eigenvalues higher than 1.
- Amount of explained variance: you can choose factors that explain 70 to 80% of your variance at least.
- Scree plot: It is a graphical method that helps us in choosing the factors until a break in the graph.

14. What is Eigenvalues and Eigenvector?
Eigenvectors are rotational axes of the linear transformation. These axes are fixed in direction, and eigenvalue is the scale factor by which the matrix is scaled up or down. Eigenvalues are also known as characteristic values or characteristic roots and eigenvectors are also known as the characteristic vector.
15. How dimensionality reduction improves the performance of SVM?
SVM works better with lower-dimensional data compared to large dimensional data. When the number of features is greater than the number of observations, then performing dimensionality reduction will generally improve the SVM.
16. What is the difference between PCA and t-SNE?
t-SNE in comparison to PCA:
- When the data is huge (in size), t-SNE may fail to produce better results.
- t-SNE is nonlinear whereas PCA is linear.
- PCA will preserve things that t-SNE will not.
- PCA is deterministic; t-SNE is not
- t-SNE does not scale well with the size of the dataset, while PCA does.
17. What are the benefits and limitations of PCA?
Benefits:
- Removes Correlated Features
- Reduces Overfitting
- Visualize large dimensional data
Limitations:
- Independent variables become less interpretable
- Data standardization is a must before PCA
- Information Loss
- assumes the Linear relationship between original features.
- High variance axes considered as components and low variance axes considered as noise.
- It assumes principal components as orthogonal.
18. What is the difference between SVD and PCA?
- Both are eigenvalue methods that are used to reduce a high-dimensional dataset into fewer dimensions for retaining important information.
- PCA is the same as SVD but it is not as efficient to compute as the SVD.
- PCA is used for finding the directions while SVD is the factorization of a matrix.
- We can use SVD to compute principal components but it is more expensive.
19. Explain DBSCAN.
The main idea is to create clusters and add objects as long as the density in its neighborhood exceeds some threshold. The density of any object measured by the number of objects closed to that. It connects the main object with its neighborhoods to form dense regions as clusters. You can also define density as the size of the neighborhood €. DBSCAN also uses another user-specified parameter, MinPts, that specifies the density threshold of dense regions.

http://primo.ai/index.php?title=Density-Based_Spatial_Clustering_of_Applications_with_Noise_(DBSCAN)
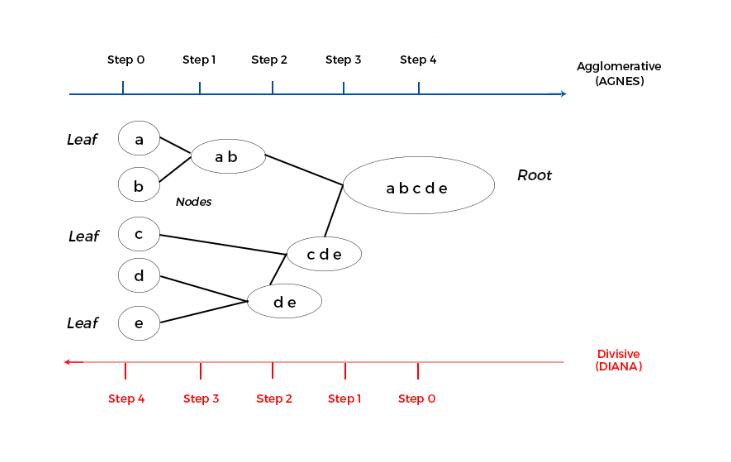
20. What is hierarchical clustering?
Hierarchical method partition data into groups at different levels such as in a hierarchy. Observations are group together on the basis of their mutual distance. Hierarchical clustering is of two types: Agglomerative and Divisive.
Agglomerative methods start with individual objects like clusters, which are iteratively merged to form larger clusters. It starts with leaves or individual records and merges two clusters that are closest to each other according to some similarity measure and form one cluster. It is also known as AGNES (AGglomerative NESting).
http://primo.ai/index.php?title=Hierarchical_Clustering;Agglomerative(HAC)%26_Divisive(HDC)
Divisive methods start with one cluster, which they iteratively split into smaller clusters. It divides the root cluster into several smaller sub-clusters, and recursively partitions those clusters into smaller ones. It is also known as DIANA (DIvisive ANAlysis).
Summary
In this article, we have focused on unsupervised learning interview questions. In the next article, we will focus on the interview questions related to data preprocessing.
Data Science Interview Questions Part-5 (Data Preprocessing)