Do you deal with data?
Your data would certainly have missing values.
Dealing with them depends on knowing why and how they are missing at the first place.
Blindly imputing with random values or mean is probably the last thing you’d want to do.
Missing values usually have a pattern within them. They have a certain correlation with other features wrt missing values.
import missingno⚡
Missingno is a sweet addition to Pandas which helps you in exploring exactly that.
Missingno comes with Matplotlib plots pre configured, which makes your task of exploring missing data painless.
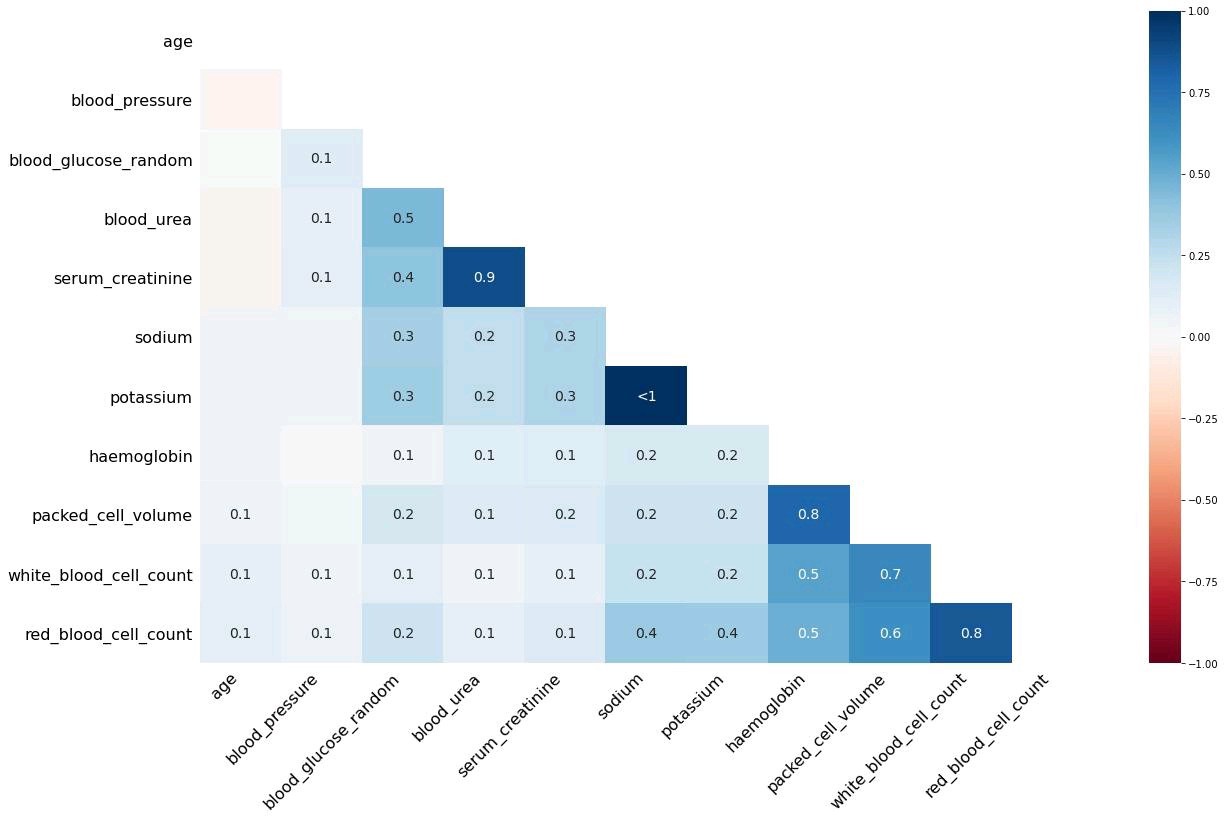
In the image below, I visualized the correlation between missing data in the Chronic Kidney Disease data from Kaggle.
The heatmap clearly shows that features Blood Urea and Serum Creatinine have a very high correlation wrt missing values.
Same with Potassium - Sodium and a few other features as well.
Missingno also has a few more handy visualizations like matrix plots, bar plots, dendrograms to get more insights into missing data.
How do you treat missing values in your data ?
Link to my Kaggle Notebook in the comments. Have a look!
#python #datascience #machinelearning